This function plots spectroscopic concenration, depth, time-series, etc. profiles by using ggplot2.
Note: The function is still experimental and may change in the future.
qplotc(
  object,
  mapping = aes_string(x = "c", y = "spc"),
  ...,
  func = NULL,
  func.args = list(),
  map.pointonly = FALSE
)
Arguments
- object
A
hyperSpecobject.- mapping
- ...
Further arguments handed to
ggplot2::geom_point().- func
Function to summarize the wavelengths. If
NULL, only the first wavelength is used.- func.args
A named list with arguments to
func.- map.pointonly
If
TRUE,mappingwill be handed toggplot2::geom_point()instead ofggplot2::ggplot().
Value
A ggplot2::ggplot() object.
See also
Examples
qplotc(flu) # Notice the warning
#> Warning: Intensity at first wavelengh only is used.
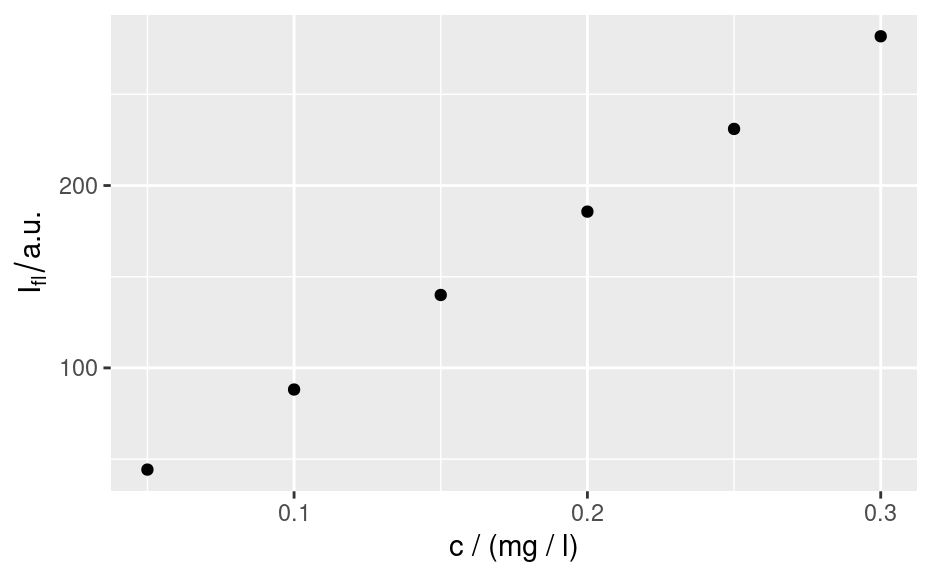
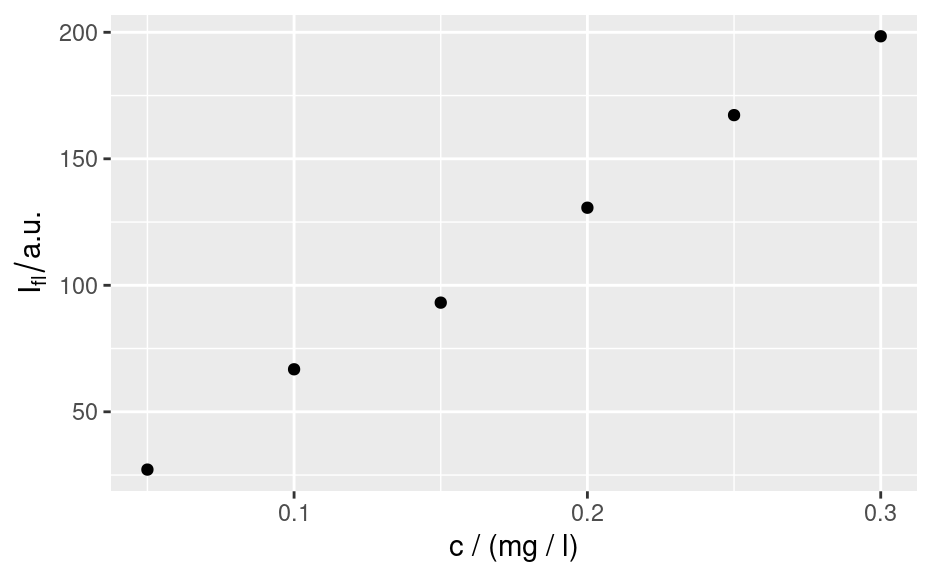 qplotc(flu[ , , 410])
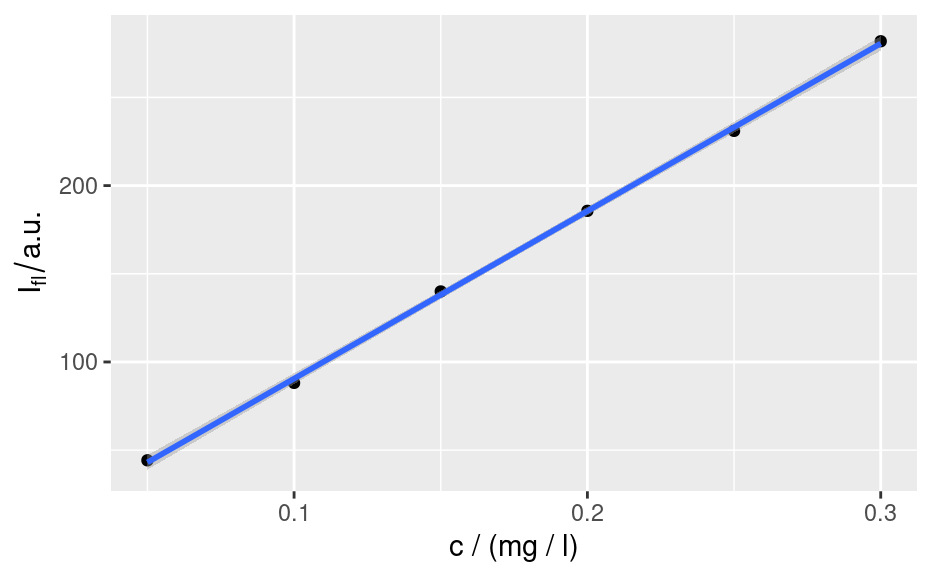
 qplotc(flu[ , , 410]) + geom_smooth(method = "lm", formula = y ~ x)
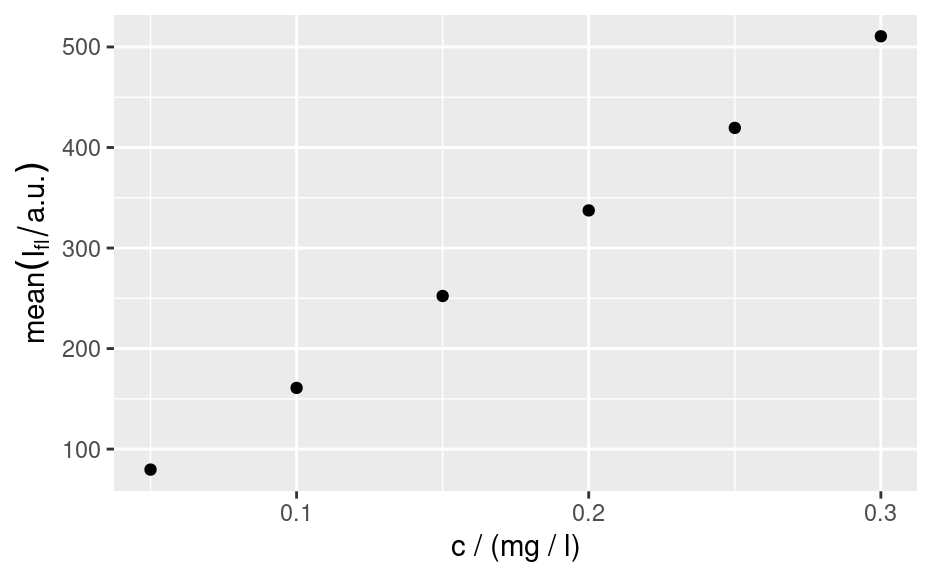
 qplotc(flu, func = mean)