This function plots false-colour map by using ggplot2 functions.
Note that qplotmap() will currently produce wrong scales if x or y are
discrete.
Note: The function is still experimental and may change in the future.
qplotmap(
  object,
  mapping = aes_string(x = "x", y = "y", fill = "spc"),
  ...,
  func = mean,
  func.args = list(),
  map.tileonly = FALSE
)
Arguments
- object
A
hyperSpecobject.- mapping
See
ggplot2::geom_tile().- ...
Further arguments handed to
ggplot2::geom_tile().- func
Function to summarize the wavelengths.
- func.args
A named list with arguments to
func.- map.tileonly
If
TRUE,mappingwill be handed toggplot2::geom_tile()instead ofggplot2::ggplot().
Value
A ggplot2::ggplot() object.
Examples
set.seed(1)
faux_cell <- generate_faux_cell()
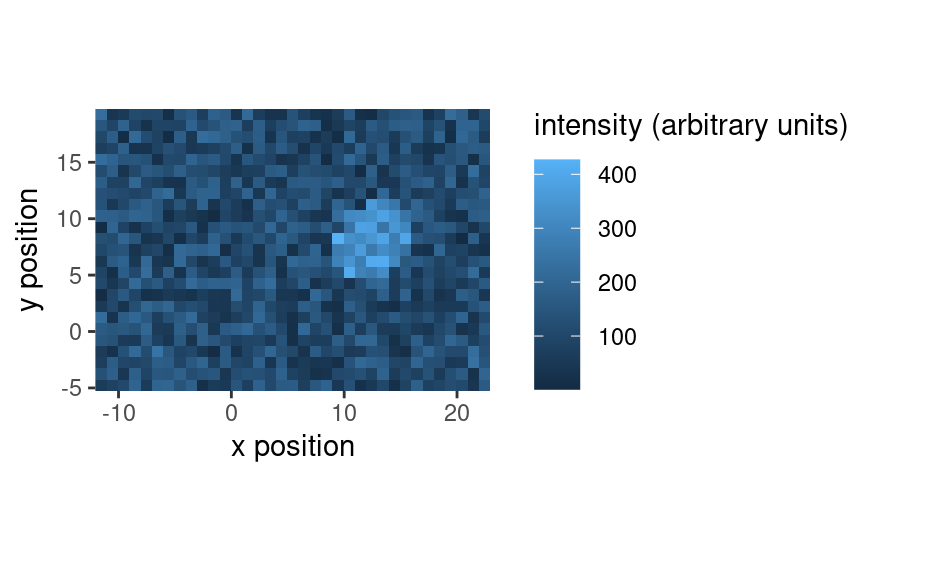
qplotmap(faux_cell[ , , 1500])
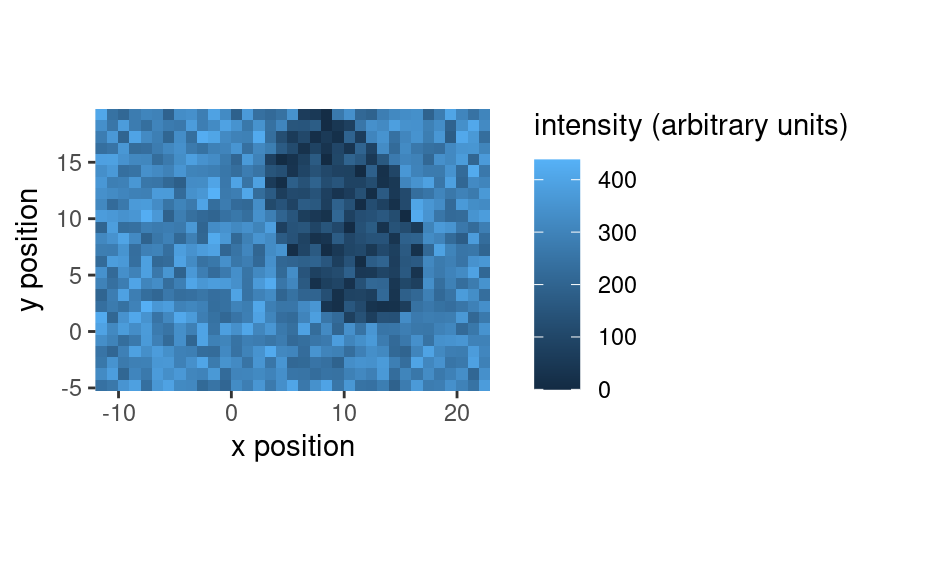
 qplotmap(faux_cell[ , , 800])
 qplotmap(faux_cell[ , , 1200]) +
scale_fill_gradientn(colours = palette_alois())
qplotmap(faux_cell[ , , 1200]) +
scale_fill_gradientn(colours = palette_alois())
