Plot False-Colour Map with Colour Mixing for Multivariate Overlay (ggplot2)
Source:R/qplotmixmap.R
qplotmixmap.RdThis function plots false-colour map with colour mixing for multivariate overlay by using ggplot2 functions.
Note: The function is still experimental and may change in the future.
qplotmixmap(object, ...)Arguments
- object
A
hyperSpecobject.- ...
Further arguments handed to
qmixlegend()andqmixtile().
Value
An invisible list with ggplot2::ggplot() objects for map and legend.
See also
Examples
set.seed(1)
faux_cell <- generate_faux_cell()
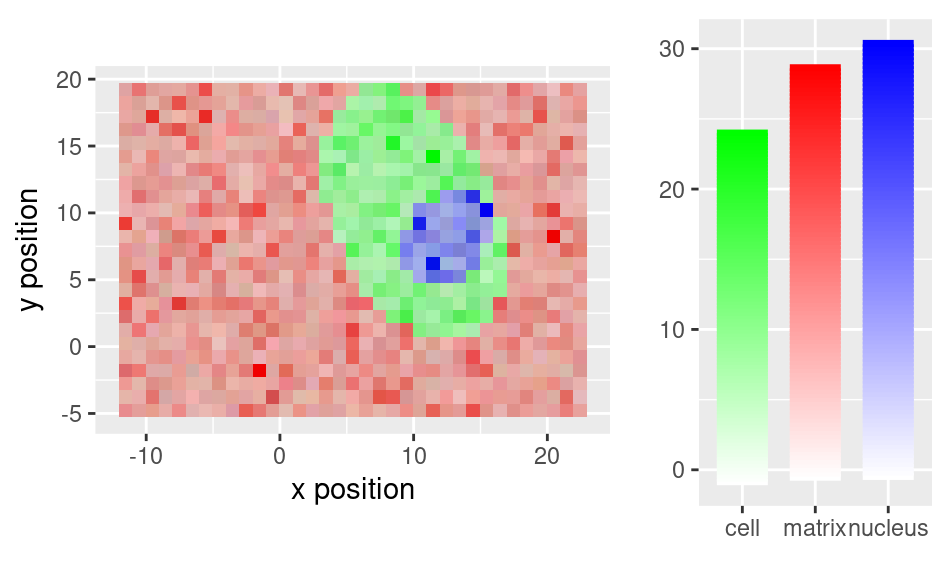
# Original data at certan wavelengths
qplotmixmap(faux_cell[, , c(800, 1200, 1500)],
purecol = c(matrix = "red", cell = "green", nucleus = "blue")
)
#> Warning: Removed 300 rows containing missing values (`geom_point()`).
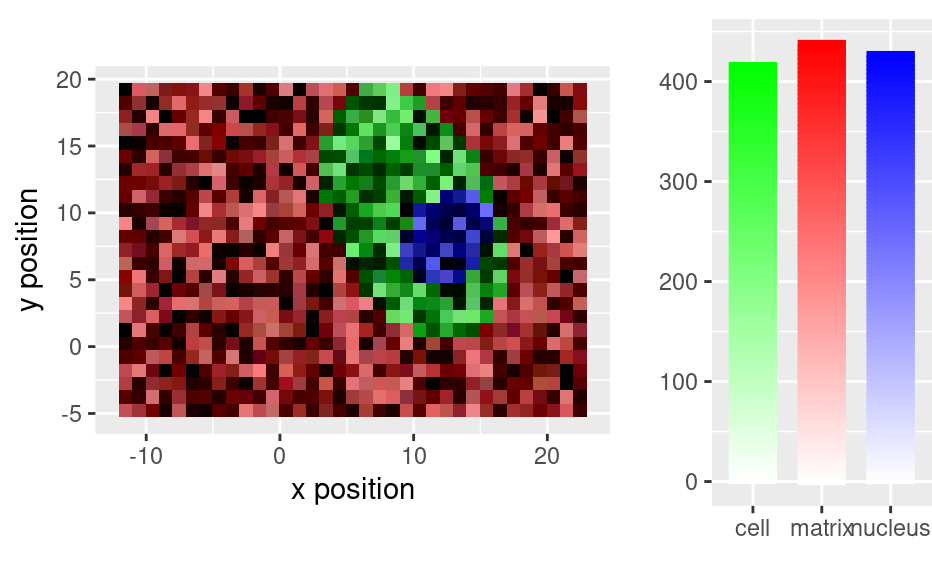 # With baseline removed
faux_cell_2 <- faux_cell - spc_fit_poly_below(faux_cell)
qplotmixmap(faux_cell_2[, , c(800, 1200, 1500)],
purecol = c(matrix = "red", cell = "green", nucleus = "blue")
)
#> Warning: Removed 300 rows containing missing values (`geom_point()`).
# With baseline removed
faux_cell_2 <- faux_cell - spc_fit_poly_below(faux_cell)
qplotmixmap(faux_cell_2[, , c(800, 1200, 1500)],
purecol = c(matrix = "red", cell = "green", nucleus = "blue")
)
#> Warning: Removed 300 rows containing missing values (`geom_point()`).
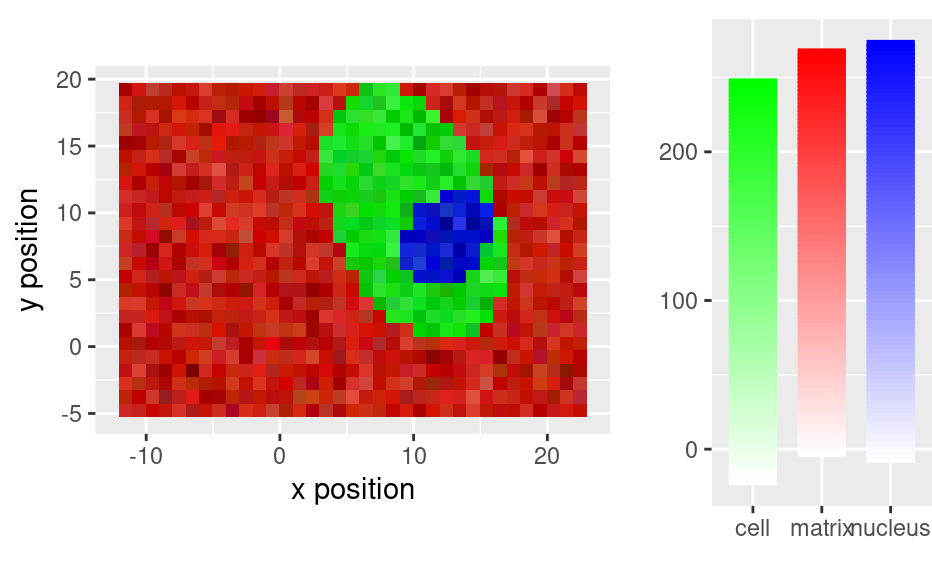 # With further pre-processing
faux_cell_3 <- faux_cell_2
faux_cell_3 <- sweep(faux_cell_3, 1, apply(faux_cell_3, 1, mean), "/")
faux_cell_3 <- sweep(faux_cell_3, 2, apply(faux_cell_3, 2, quantile, 0.05), "-")
qplotmixmap(faux_cell_3[, , c(800, 1200, 1500)],
purecol = c(matrix = "red", cell = "green", nucleus = "blue")
)
#> Warning: Removed 300 rows containing missing values (`geom_point()`).
# With further pre-processing
faux_cell_3 <- faux_cell_2
faux_cell_3 <- sweep(faux_cell_3, 1, apply(faux_cell_3, 1, mean), "/")
faux_cell_3 <- sweep(faux_cell_3, 2, apply(faux_cell_3, 2, quantile, 0.05), "-")
qplotmixmap(faux_cell_3[, , c(800, 1200, 1500)],
purecol = c(matrix = "red", cell = "green", nucleus = "blue")
)
#> Warning: Removed 300 rows containing missing values (`geom_point()`).