This function plots spectroscopic line plot by using ggplot2.
By default, only a few spectra are plotted (see argument spc.nmax).
Note: The function is still experimental and may change in the future.
qplotspc(
  x,
  wl.range = TRUE,
  ...,
  mapping = aes_string(x = ".wavelength", y = "spc", group = ".rownames"),
  spc.nmax = hy_get_option("ggplot.spc.nmax"),
  map.lineonly = FALSE,
  debuglevel = hy_get_option("debuglevel")
)
Arguments
- x
A
hyperSpecobject.- wl.range
Wavelength ranges to plot.
- ...
Further arguments handed to
ggplot2::geom_line().- mapping
see
ggplot2::geom_line().- spc.nmax
(integer) Maximum number of spectra to plot.
- map.lineonly
If
TRUE,mappingwill be handed toggplot2::geom_line()instead ofggplot2::ggplot().- debuglevel
(
0|1|2|3) If > 0, additional debug output is produced.
Value
A ggplot2::ggplot() object.
Examples
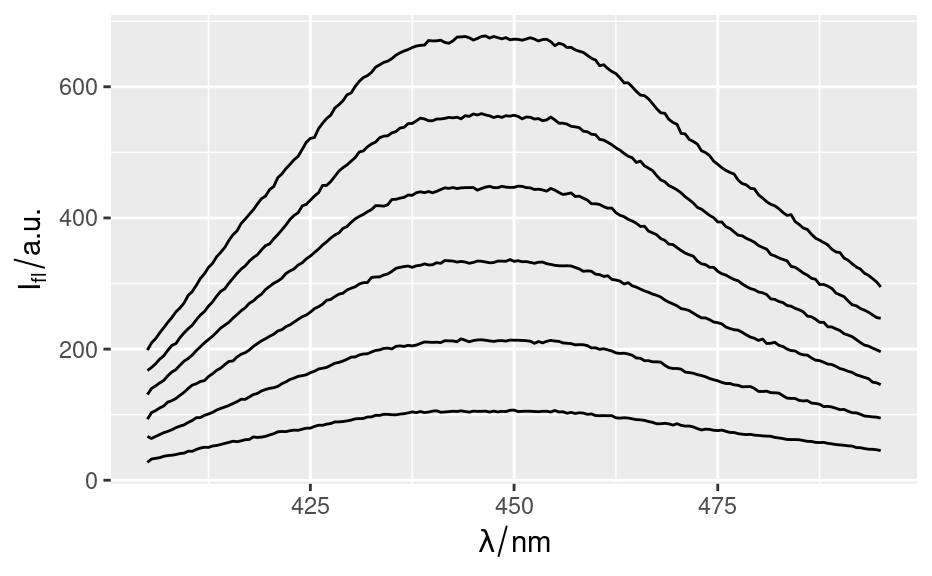
qplotspc(flu)
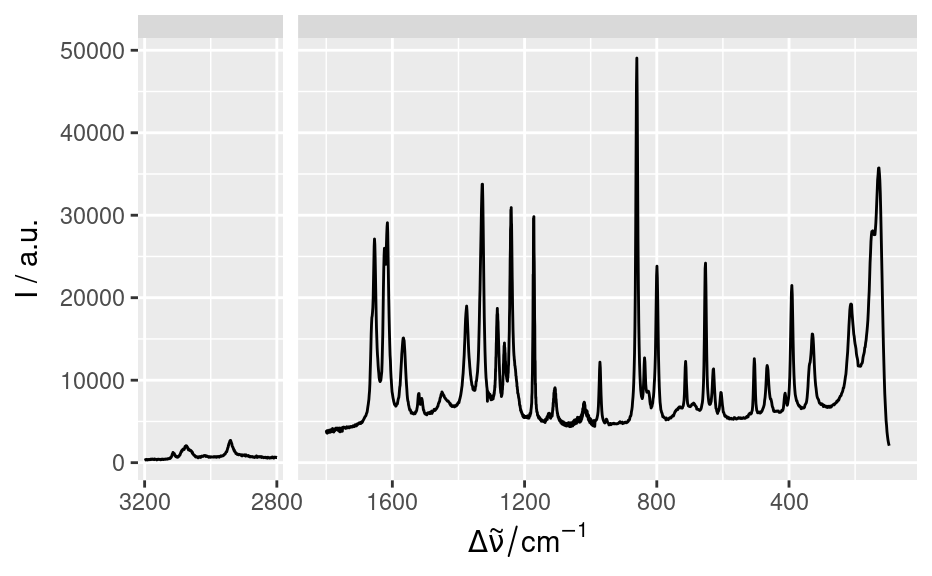
 qplotspc(paracetamol, c(2800 ~ max, min ~ 1800)) +
scale_x_reverse(breaks = seq(0, 3200, 400))
#> Warning: Unable to calculate text width/height (using zero)
#> Warning: Unable to calculate text width/height (using zero)
#> Warning: Unable to calculate text width/height (using zero)
#> Warning: Unable to calculate text width/height (using zero)
qplotspc(paracetamol, c(2800 ~ max, min ~ 1800)) +
scale_x_reverse(breaks = seq(0, 3200, 400))
#> Warning: Unable to calculate text width/height (using zero)
#> Warning: Unable to calculate text width/height (using zero)
#> Warning: Unable to calculate text width/height (using zero)
#> Warning: Unable to calculate text width/height (using zero)
 set.seed(1)
faux_cell <- generate_faux_cell()
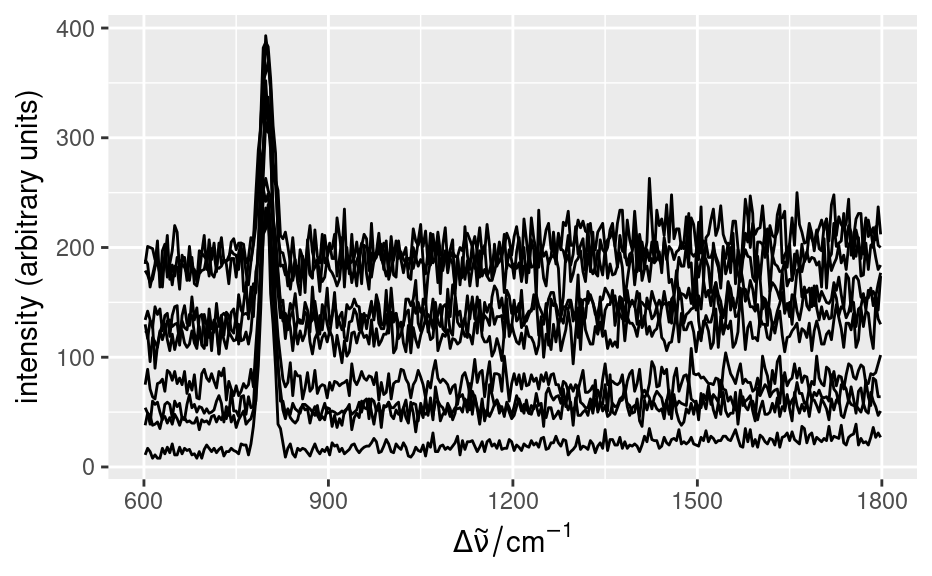
qplotspc(faux_cell)
set.seed(1)
faux_cell <- generate_faux_cell()
qplotspc(faux_cell)
 qplotspc(
aggregate(faux_cell, faux_cell$region, mean),
mapping = aes(x = .wavelength, y = spc, colour = region)
) +
facet_grid(region ~ .)
qplotspc(
aggregate(faux_cell, faux_cell$region, mean),
mapping = aes(x = .wavelength, y = spc, colour = region)
) +
facet_grid(region ~ .)
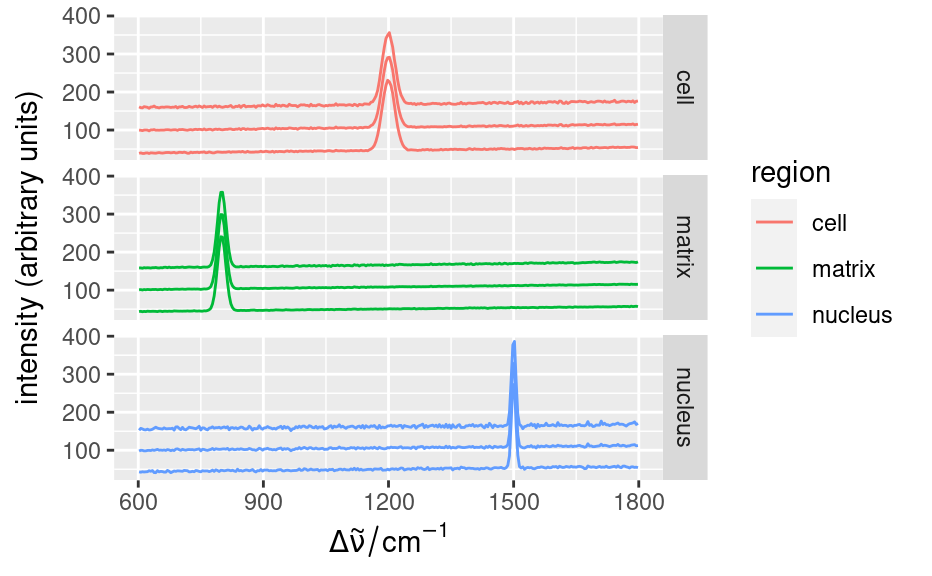
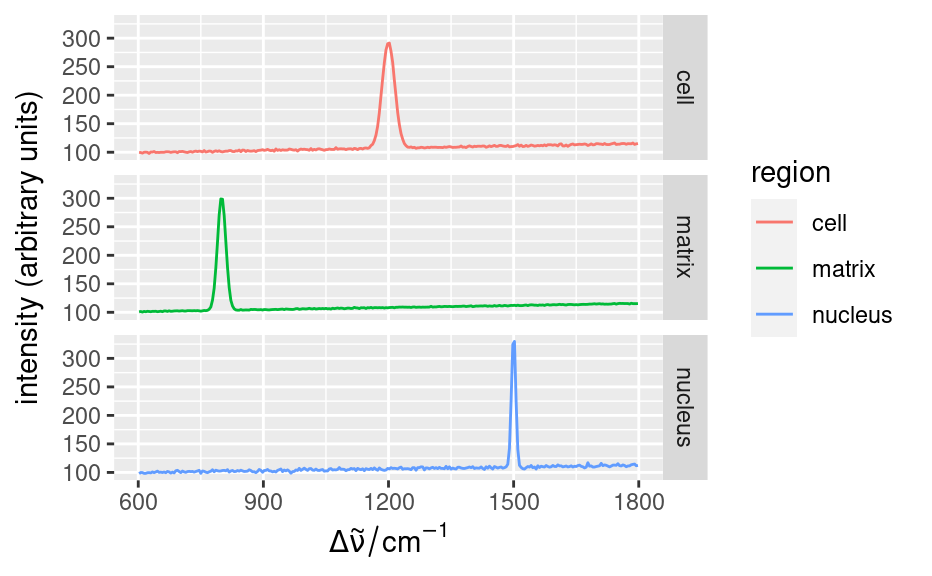 qplotspc(
aggregate(faux_cell, faux_cell$region, mean_pm_sd),
mapping = aes(x = .wavelength, y = spc, colour = region, group = .rownames)
) +
facet_grid(region ~ .)
qplotspc(
aggregate(faux_cell, faux_cell$region, mean_pm_sd),
mapping = aes(x = .wavelength, y = spc, colour = region, group = .rownames)
) +
facet_grid(region ~ .)