(DEPRECATED) Spectra plotting with ggplot2 was moved to hySpc.ggplot2
Source:R/DEPRECATED-ggplot2.R
DEPRECATED-ggplot2.RdThese ggplot2-related hyperSpec functions are deprecated
and they will be removed in the next release of the package.
Now functions from package hySpc.ggplot2
(link)
should be used as alternatives to plot hyperSpec objects with ggplot2.
qplotspc(
  x,
  wl.range = TRUE,
  ...,
  mapping = aes_string(x = ".wavelength", y = "spc", group = ".rownames"),
  spc.nmax = hy_get_option("ggplot.spc.nmax"),
  map.lineonly = FALSE,
  debuglevel = hy_get_option("debuglevel")
)

qplotmap(
  object,
  mapping = aes_string(x = "x", y = "y", fill = "spc"),
  ...,
  func = mean,
  func.args = list(),
  map.tileonly = FALSE
)

qplotc(
  object,
  mapping = aes_string(x = "c", y = "spc"),
  ...,
  func = NULL,
  func.args = list(),
  map.pointonly = FALSE
)

qplotmixmap(object, ...)

legendright(p, l, legend.width = 8, legend.unit = "lines")

qmixtile(
  object,
  purecol = stop("pure component colors needed."),
  mapping = aes_string(x = "x", y = "y", fill = "spc"),
  ...,
  map.tileonly = FALSE
)

normalize.colrange(x, na.rm = TRUE, legend = FALSE, n = 100, ...)

normalize.range(x, na.rm = TRUE, legend = FALSE, n = 100, ...)

normalize.null(x, na.rm = TRUE, legend = FALSE, n = 100, ...)

normalize.minmax(x, min = 0, max = 1, legend = FALSE, n = 100, ...)

qmixlegend(
  x,
  purecol,
  dx = 0.33,
  ny = 100,
  labels = names(purecol),
  normalize = normalize.colrange,
  ...
)

colmix.rgb(
  x,
  purecol,
  against = 1,
  sub = TRUE,
  normalize = normalize.colrange,
  ...
)
Arguments
- x
matrix with component intensities in columns
- wl.range
wavelength ranges to plot
- ...
qmixtile: handed tocolmix.rgb()qmixlegend()andcolmix.rgb()hand further arguments to thenormalizefunction- mapping
- spc.nmax
maximum number of spectra to plot
- map.lineonly
if
TRUE,mappingwill be handed toggplot2::geom_line()instead ofggplot2::ggplot().- debuglevel
if > 0, additional debug output is produced
- object
matrix to be plotted with mixed colour channels
- func
function to summarize the wavelengths, if
NULL, only the first wavelength is used- func.args
arguments to
func- map.tileonly
if
TRUE,mappingwill be handed toggplot2::geom_tile()instead ofggplot2::ggplot().- map.pointonly
if
TRUE,mappingwill be handed toggplot2::geom_point()instead ofggplot2::ggplot().- p
plot object
- l
legend object
- legend.width, legend.unit
size of legend part
- purecol
pure component colours, names determine legend labels
- na.rm
see
base::min()- legend
should a legend be produced instead of normalized values?
- n
of colours to produce in legend
- min
numeric with value corresponding to "lowest" colour for each column
- max
numeric with value corresponding to "hightest" colour for each column
- dx
width of label bar
- ny
number of colours in legend
- labels
component names
- normalize
function to normalize the values.
- against
value to mix against (for
sub = TRUEonly, 1 = white, 0 = black)- sub
subtractive color mixing?
Examples
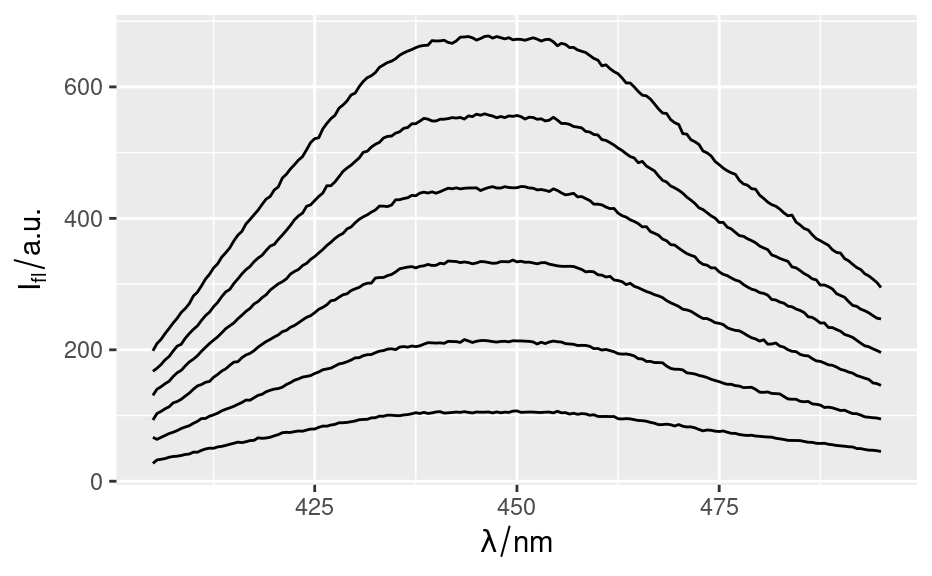
qplotspc(flu)
#> Warning: Function 'qplotspc' is deprecated.
#> Use function 'qplotspc' from package 'hySpc.ggplot2' instead.
#> https://r-hyperspec.github.io/hySpc.ggplot2
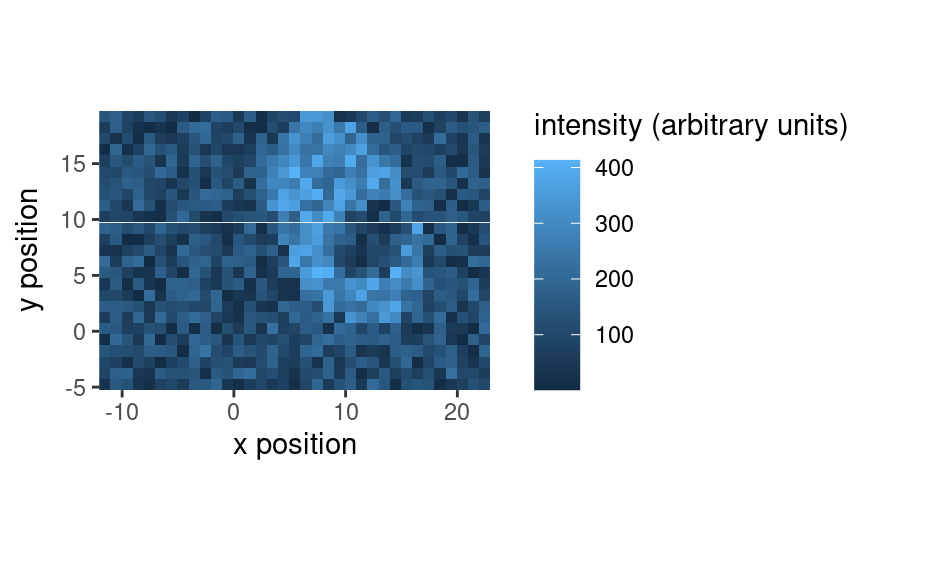
 qplotmap(faux_cell[, , 1200])
#> Warning: Function 'qplotmap' is deprecated.
#> Use function 'qplotmap' from package 'hySpc.ggplot2' instead.
#> https://r-hyperspec.github.io/hySpc.ggplot2
qplotmap(faux_cell[, , 1200])
#> Warning: Function 'qplotmap' is deprecated.
#> Use function 'qplotmap' from package 'hySpc.ggplot2' instead.
#> https://r-hyperspec.github.io/hySpc.ggplot2
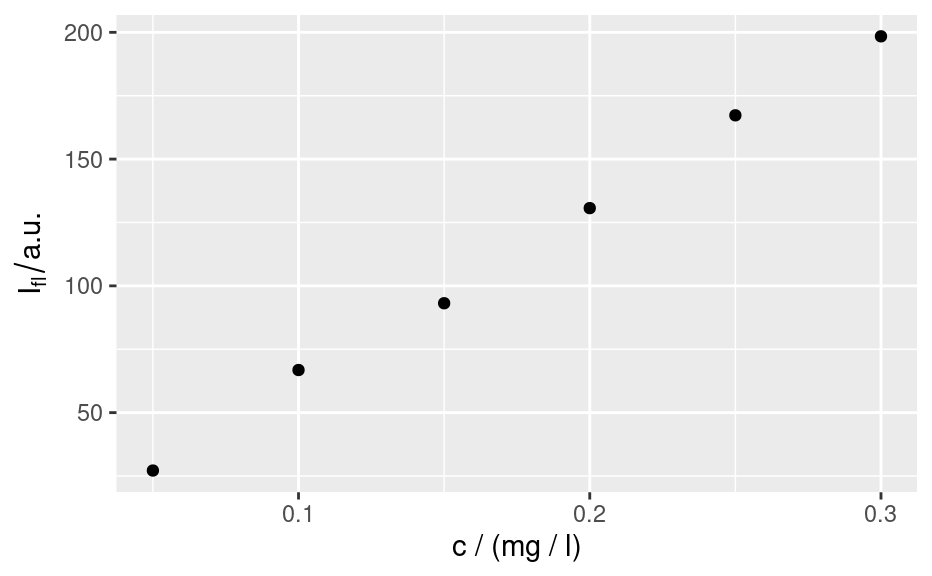
 qplotc(flu)
#> Warning: Function 'qplotc' is deprecated.
#> Use function 'qplotc' from package 'hySpc.ggplot2' instead.
#> https://r-hyperspec.github.io/hySpc.ggplot2
#> Warning: Intensity at first wavelengh only is used.
qplotc(flu)
#> Warning: Function 'qplotc' is deprecated.
#> Use function 'qplotc' from package 'hySpc.ggplot2' instead.
#> https://r-hyperspec.github.io/hySpc.ggplot2
#> Warning: Intensity at first wavelengh only is used.
 faux_cell <- faux_cell - spc_fit_poly_below(faux_cell)
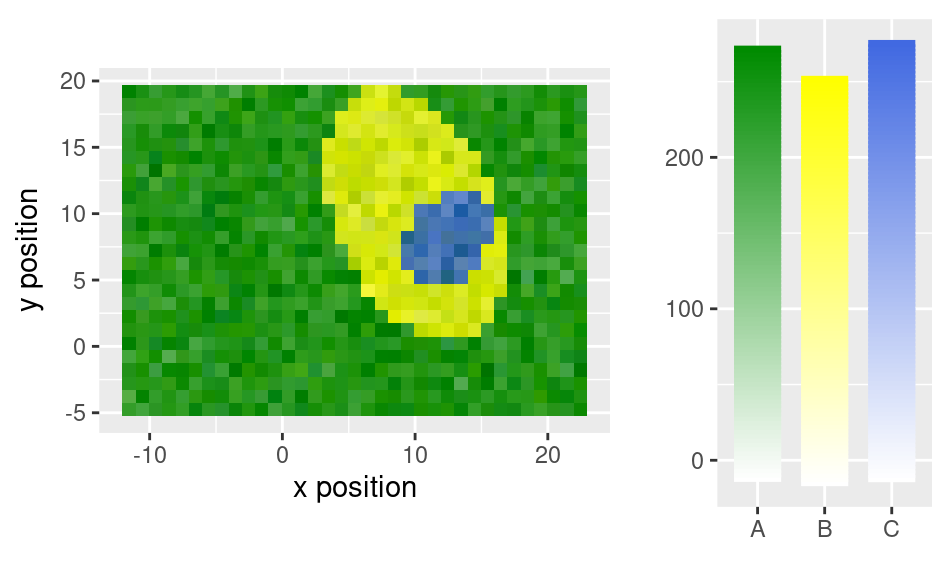
qplotmixmap(faux_cell[, , c(800, 1200, 1500)],
purecol = c(A = "green4", B = "yellow", C = "royalblue")
)
#> Warning: Function 'qplotmixmap' is deprecated.
#> Use function 'qplotmixmap' from package 'hySpc.ggplot2' instead.
#> https://r-hyperspec.github.io/hySpc.ggplot2
#> Warning: Removed 300 rows containing missing values or values outside the scale range
#> (`geom_point()`).
faux_cell <- faux_cell - spc_fit_poly_below(faux_cell)
qplotmixmap(faux_cell[, , c(800, 1200, 1500)],
purecol = c(A = "green4", B = "yellow", C = "royalblue")
)
#> Warning: Function 'qplotmixmap' is deprecated.
#> Use function 'qplotmixmap' from package 'hySpc.ggplot2' instead.
#> https://r-hyperspec.github.io/hySpc.ggplot2
#> Warning: Removed 300 rows containing missing values or values outside the scale range
#> (`geom_point()`).