(DEPRECATED) LOESS smoothing interpolation for spectra
Source:R/DEPRECATED-spc_loess.R
DEPRECATED-spc.loess.RdThese hyperSpec functions are deprecated and not maintained any more. You should not use these. Currently they are present due to back-compatibility reasons and will be removed in the next release of the package. Please, use the suggested alternative functions instead.
_____________
Spectra smoothing and interpolation on a new wavelength axis using
stats::loess().
spc.loess(spc, newx, enp.target = nwl(spc)/4, surface = "direct", ...)Arguments
- spc
The
hyperSpecobject.- newx
Wavelength axis to interpolate on.
- enp.target, surface, ...
Further parameters for
stats::loess()andstats::loess.control().
Value
A new hyperSpec object.
Details
Applying stats::loess() to each of the spectra, an interpolation onto a new
wavelength axis is performed. At the same time, the spectra are smoothed in
order to increase the signal to noise ratio. See stats::loess() and
stats::loess.control() on the parameters that control the amount of
smoothing.
See also
Examples
data(flu, package = "hyperSpec")
nwl(flu)
#> [1] 181
smoothed_flu <- spc.loess(flu, seq(420, 470, 5))
#> Warning: Function 'spc.loess' is deprecated.
#> Use function 'spc_loess' instead.
#> Warning: Function '.fix_spc_colnames' is deprecated.
nwl(smoothed_flu)
#> [1] 11
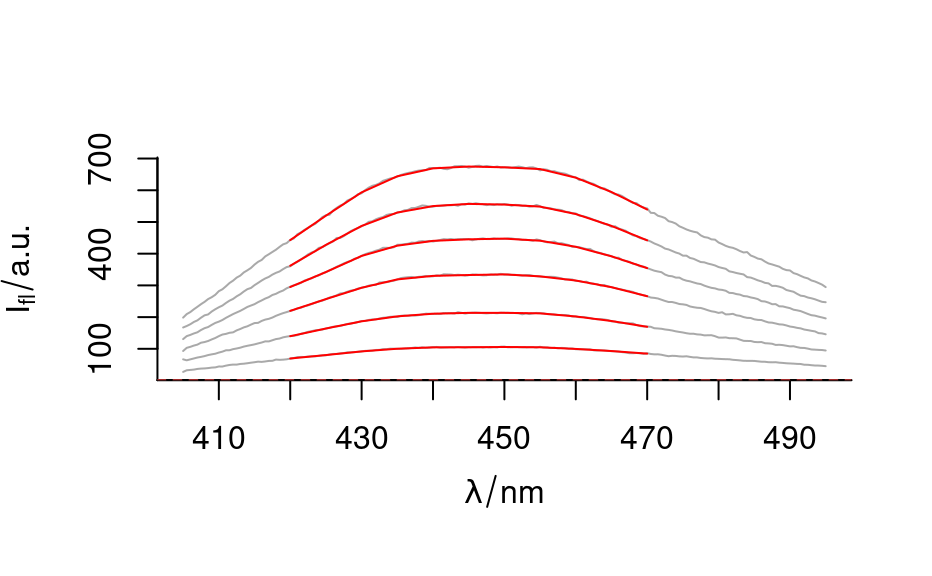
plot(flu, col = "darkgray")
plot(smoothed_flu, add = TRUE, col = "red")
 flu_na <- flu
flu_na[[3, ]] <- NA_real_
flu_na_smoothed <- spc.loess(flu_na, seq(420, 470, 5))
#> Warning: Function 'spc.loess' is deprecated.
#> Use function 'spc_loess' instead.
#> Warning: NAs were generated. Probably `newx` was outside the spectral range covered by `spc`.
#> Warning: Function '.fix_spc_colnames' is deprecated.
flu_na_smoothed[[]]
#> 420 425 430 435 440 445 450 455
#> [1,] 69.37812 80.30948 91.84728 100.2360 104.5292 104.9064 105.7577 104.8149
#> [2,] 139.77571 164.01308 186.70646 202.3563 210.6401 213.3784 213.4778 211.8374
#> [3,] NA NA NA NA NA NA NA NA
#> [4,] 294.90432 342.15512 392.92353 425.2415 440.4607 445.2538 447.5044 440.8911
#> [5,] 362.00455 427.75670 487.47455 529.7585 550.0944 556.9861 554.9146 548.4495
#> [6,] 442.89661 519.84822 593.45501 644.1054 669.0614 674.8410 672.3328 666.8127
#> 460 465 470
#> [1,] 99.62751 92.9669 84.80506
#> [2,] 201.97621 187.6462 169.38644
#> [3,] NA NA NA
#> [4,] 421.76483 391.7258 354.35753
#> [5,] 524.96452 487.5104 441.95012
#> [6,] 639.70144 594.3875 539.25115
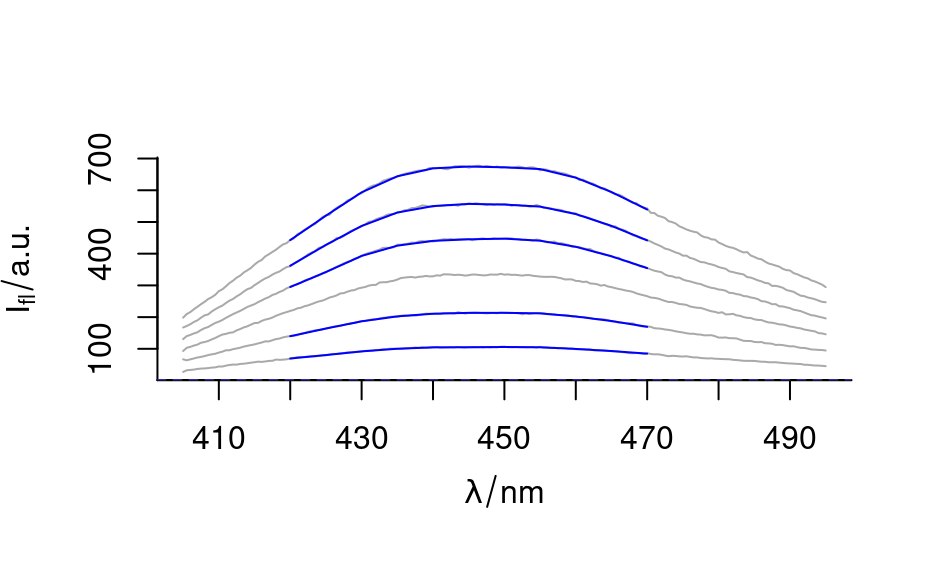
plot(flu, col = "darkgray")
plot(flu_na_smoothed, add = TRUE, col = "blue")
flu_na <- flu
flu_na[[3, ]] <- NA_real_
flu_na_smoothed <- spc.loess(flu_na, seq(420, 470, 5))
#> Warning: Function 'spc.loess' is deprecated.
#> Use function 'spc_loess' instead.
#> Warning: NAs were generated. Probably `newx` was outside the spectral range covered by `spc`.
#> Warning: Function '.fix_spc_colnames' is deprecated.
flu_na_smoothed[[]]
#> 420 425 430 435 440 445 450 455
#> [1,] 69.37812 80.30948 91.84728 100.2360 104.5292 104.9064 105.7577 104.8149
#> [2,] 139.77571 164.01308 186.70646 202.3563 210.6401 213.3784 213.4778 211.8374
#> [3,] NA NA NA NA NA NA NA NA
#> [4,] 294.90432 342.15512 392.92353 425.2415 440.4607 445.2538 447.5044 440.8911
#> [5,] 362.00455 427.75670 487.47455 529.7585 550.0944 556.9861 554.9146 548.4495
#> [6,] 442.89661 519.84822 593.45501 644.1054 669.0614 674.8410 672.3328 666.8127
#> 460 465 470
#> [1,] 99.62751 92.9669 84.80506
#> [2,] 201.97621 187.6462 169.38644
#> [3,] NA NA NA
#> [4,] 421.76483 391.7258 354.35753
#> [5,] 524.96452 487.5104 441.95012
#> [6,] 639.70144 594.3875 539.25115
plot(flu, col = "darkgray")
plot(flu_na_smoothed, add = TRUE, col = "blue")