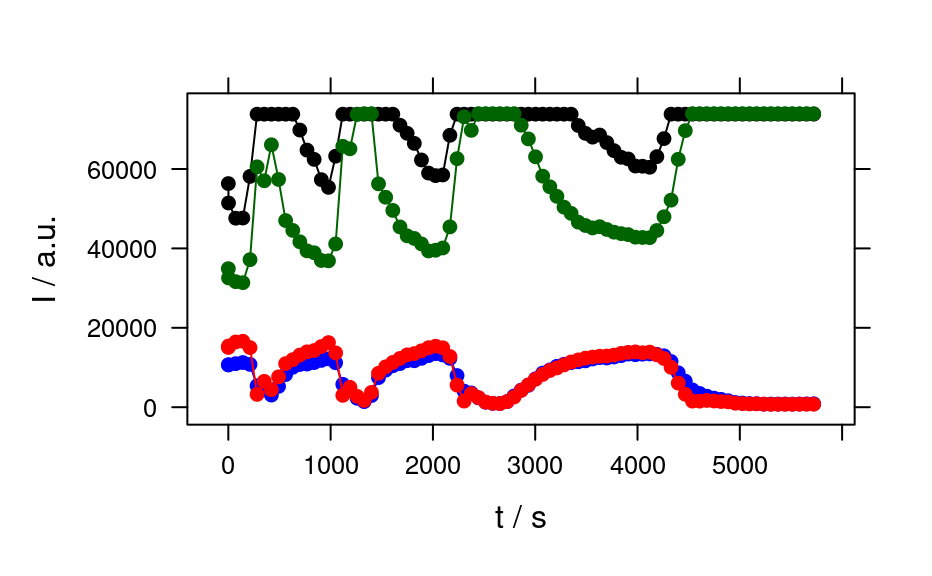
A time series of an unstable laser emission.
Format
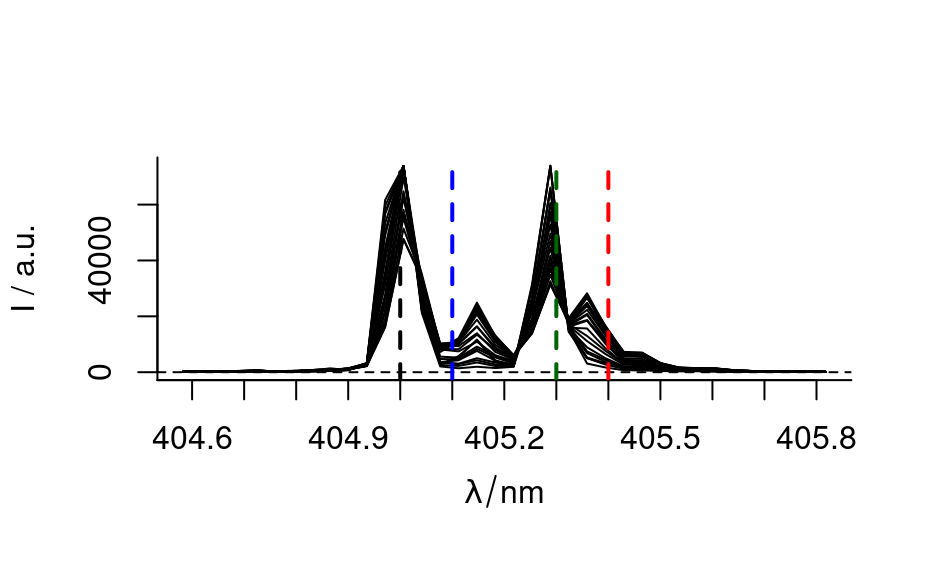
The data set consists of 84 laser emission spectra measured during 95 min. Each spectrum has 36 data points in the range of 404.5 nm to 405.8 nm.
See also
See the vignette vignette("laser", package = "hyperSpec").
Examples
laser
#> hyperSpec object
#> 84 spectra
#> 3 data columns
#> 36 data points / spectrum
cols <- c("black", "blue", "darkgreen", "red")
wl <- c(405.0, 405.1, 405.3, 405.4)
plot_spc(laser, axis.args = list(x = list(at = seq(404.5, 405.8, .1))))
for (i in seq_along(wl)) {
abline(v = wl[i], col = cols[i], lwd = 2, lty = 2)
}
 plot_c(laser[, , wl], spc ~ t,
groups = .wavelength, type = "b",
col = cols
)
plot_c(laser[, , wl], spc ~ t,
groups = .wavelength, type = "b",
col = cols
)
 if (FALSE) {
vignette("laser", package = "hyperSpec")
}
if (FALSE) {
vignette("laser", package = "hyperSpec")
}