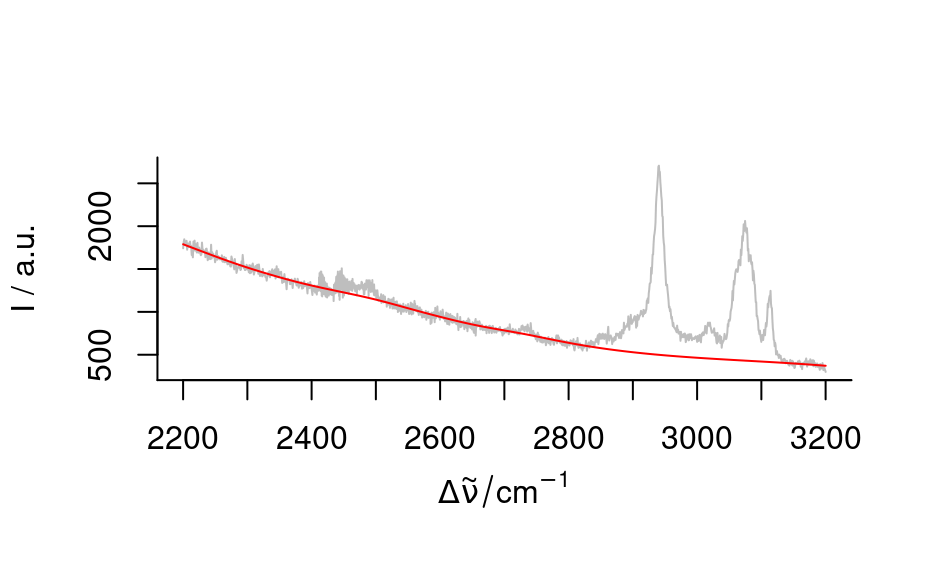
Spectral smoothing by splines.
spc_smooth_spline(spc, newx = wl(spc), ...)Arguments
- spc
hyperSpecobject- newx
wavelength axis to interpolate on
- ...
further parameters handed to
stats::smooth.spline()
Value
hyperSpec object containing smoothed spectra
Note
This function is still experimental

