Modifies a list of lattice arguments (as for lattice::levelplot(), etc.) according to
the factor levels. The colorkey will shows all levels (including unused), and the drawing colors
will be set accordingly.
trellis.factor.key(f, levelplot.args = list())Arguments
- f
the factor that will be color-coded
- levelplot.args
a list with levelplot arguments
Value
the modified list with levelplot arguments.
Details
trellis.factor.key is used during levelplot-based plotting of factors (for
hyperSpec objects) unless transform.factor = FALSE is specified.
See also
Examples
faux_cell$z <- factor(rep(c("a", "a", "d", "c"),
length.out = nrow(faux_cell)
),
levels = letters[1:4]
)
str(trellis.factor.key(faux_cell$z))
#> List of 3
#> $ at : num [1:5] 0.5 1.5 2.5 3.5 4.5
#> $ col.regions: chr [1:4] "#FCFFDD" "#98DCBB" "#0095AF" "#26185F"
#> $ colorkey :List of 1
#> ..$ lab:List of 2
#> .. ..$ at : int [1:4] 1 2 3 4
#> .. ..$ lab: chr [1:4] "a" "b" "c" "d"
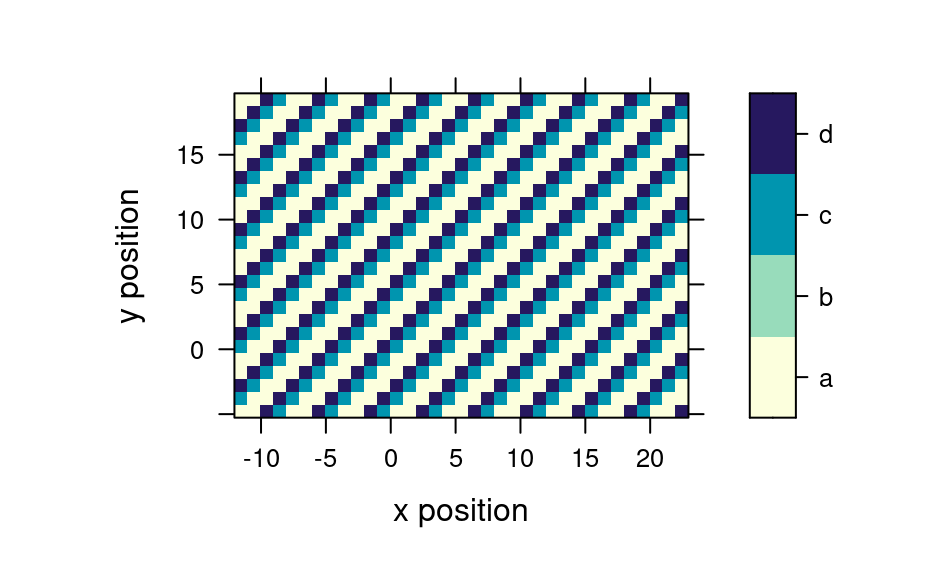
plot_map(faux_cell, z ~ x * y)
#> Warning: device support for raster images unknown, ignoring 'raster=TRUE'
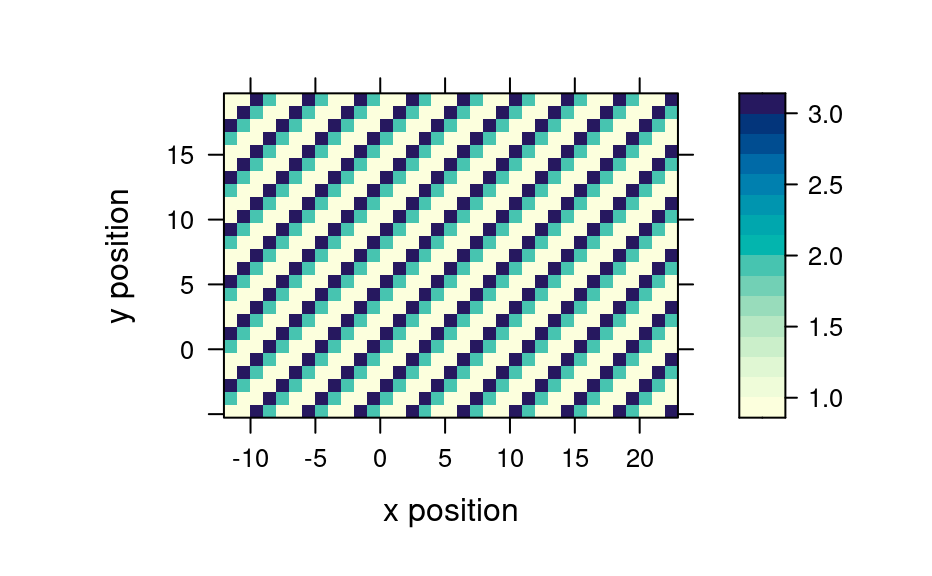
 ## switch off using trellis.factor.key:
## note that the factor levels are collapsed to c(1, 2, 3) rather than
## c (1, 3, 4)
plot_map(faux_cell, z ~ x * y, transform.factor = FALSE)
#> Warning: device support for raster images unknown, ignoring 'raster=TRUE'
## switch off using trellis.factor.key:
## note that the factor levels are collapsed to c(1, 2, 3) rather than
## c (1, 3, 4)
plot_map(faux_cell, z ~ x * y, transform.factor = FALSE)
#> Warning: device support for raster images unknown, ignoring 'raster=TRUE'
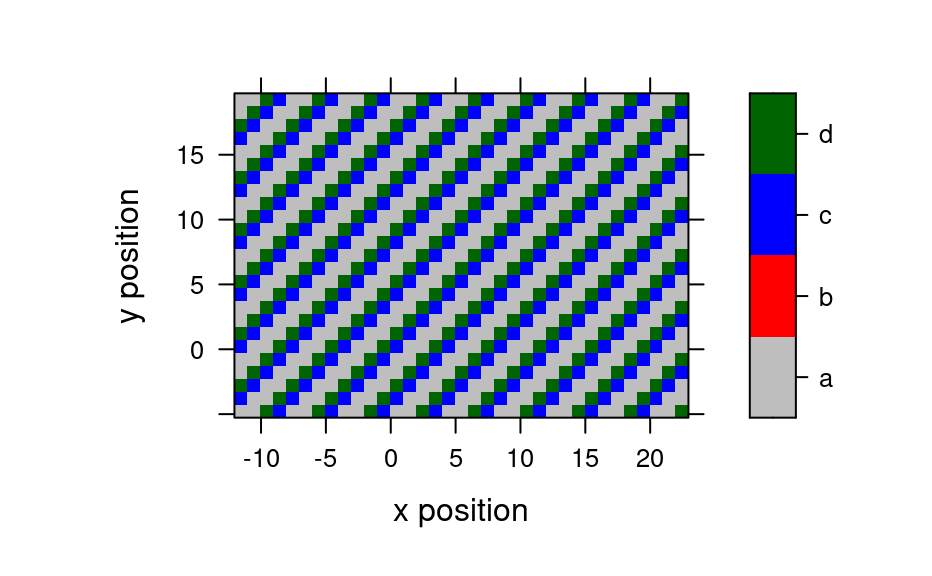
 plot_map(faux_cell, z ~ x * y,
col.regions = c("gray", "red", "blue", "dark green")
)
#> Warning: device support for raster images unknown, ignoring 'raster=TRUE'
plot_map(faux_cell, z ~ x * y,
col.regions = c("gray", "red", "blue", "dark green")
)
#> Warning: device support for raster images unknown, ignoring 'raster=TRUE'