Plot a map and identify/select spectra in the map
Source:R/plot_map.R, R/levelplot.R, R/map_identify.R, and 1 more
levelplot.Rdlattice::levelplot() functions for hyperSpec objects.
An image or map of a summary value of each spectrum is plotted.
Spectra may be identified by mouse click.
plot_map(object, model = spc ~ x * y, func = mean, func.args = list(), ...)

# S4 method for formula,hyperSpec
levelplot(
  x,
  data,
  transform.factor = TRUE,
  ...,
  contour = FALSE,
  useRaster = !contour
)

# S4 method for hyperSpec,missing
levelplot(x, data, ...)

map.identify(
  object,
  model = spc ~ x * y,
  voronoi = FALSE,
  ...,
  tol = 0.02,
  warn = TRUE
)

plot_voronoi(
  object,
  model = spc ~ x * y,
  use.tripack = "DEPRECATED",
  mix = "DEPRECATED",
  ...
)
Arguments
- object, data
the
hyperSpecobject- model, x
formula specifying the columns of object that are to be displayed by
lattice::levelplot()- func, func.args
Before plotting,
plot_mapapplies functionfuncwith the arguments given in the listfunc.argsto each of the spectra. Thus a single summary value is displayed for each of the spectra.This can be suppressed manually by setting
functo NULL. It is automatically suppressed if.wavelengthappears in the formula.- ...
further arguments are passed down the call chain, and finally to
lattice::levelplot()- transform.factor
If the color-coded variable is a factor, should
trellis.factor.key()be used to compute the color coding and legend?- contour, useRaster
- voronoi
Should the plot for identifying spectra by mouse click be produced by
plot_map(default) orplot_voronoi?- tol
tolerance for
map.identifyas fraction of the viewport (i.e. in "npc" units)- warn
should a warning be issued if no point is within the specified tolerance? See also details.
- use.tripack
(DEPRECATED) See latticeExtra::panel.voronoi for details.
- mix
(DEPRECATED) This argument is deprecated due to deprecation of argument
use.tripack.
Value
map.identify returns a vector of row indices into
object of the clicked points.
The other functions return a lattice object.
Details
The model can contain the special column name .wavelength to specify
the wavelength axis.
plot_map, map.identify, and the levelplot methods internally use the same
gateway function to lattice::levelplot(). Thus transform.factor can be used
with all of them and the panel function defaults to lattice::panel.levelplot.raster()
for all three. Two special column names, .rownames and .wavelength may be used.
levelplot plots the spectra matrix.
plot_voronoi calls plot_map with different default settings, namely the
panel function defaults to latticeExtra::panel.voronoi().
latticeExtra::panel.voronoi() depends on either of the packages interp or deldir
being installed. For further information, please consult the help page of
latticeExtra::panel.voronoi().
map.identify() calls plot_map() and plot_voronoi(), respectively and waits for
(left) mouse clicks on points. Other mouse clicks end the input.
Unlike lattice::panel.identify(), the indices returned by map.identify are in
the same order as the points were clicked. Also, multiple clicks on the same point are returned
as multiple entries with the same index.
map.identify uses option debuglevel similar to identify_spc():
debuglevel == 1 will plot the tolerance window if no data point was inside (and
additionally labels the point) while debuglevel == 2 will always plot the tolerance
window.
The map.sel.* functions offer further interactive selection, see
map.sel.poly().
See also
vignette(plotting), vignette(hyperSpec)
trellis.factor.key() for improved color coding of factors
Examples
if (FALSE) {
vignette(plotting)
vignette(hyperSpec)
}
levelplot(spc ~ y * x, faux_cell[, , 1003]) # properly rotated
#> Warning: device support for raster images unknown, ignoring 'raster=TRUE'
 plot_map(faux_cell[, , 1003])
#> Warning: device support for raster images unknown, ignoring 'raster=TRUE'
plot_map(faux_cell[, , 1003])
#> Warning: device support for raster images unknown, ignoring 'raster=TRUE'
 # plot spectra matrix
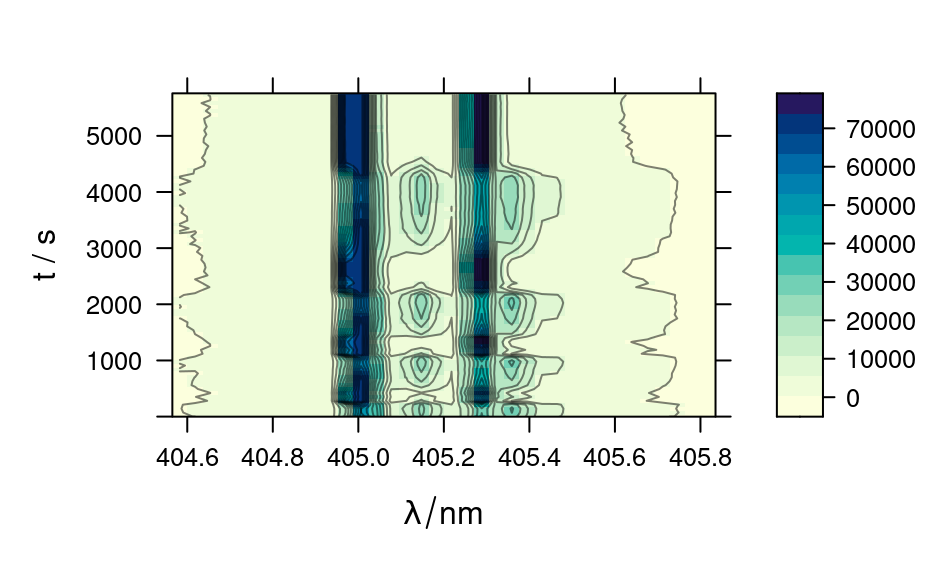
levelplot(spc ~ .wavelength * t, laser, contour = TRUE, col = "#00000080")
# plot spectra matrix
levelplot(spc ~ .wavelength * t, laser, contour = TRUE, col = "#00000080")
 # see also plot_matrix
plot_map(faux_cell, region ~ x * y)
#> Warning: device support for raster images unknown, ignoring 'raster=TRUE'
# see also plot_matrix
plot_map(faux_cell, region ~ x * y)
#> Warning: device support for raster images unknown, ignoring 'raster=TRUE'
 # Voronoi plots
smpl <- sample(faux_cell, 300)
plot_map(smpl, region ~ x * y)
#> Warning: device support for raster images unknown, ignoring 'raster=TRUE'
# Voronoi plots
smpl <- sample(faux_cell, 300)
plot_map(smpl, region ~ x * y)
#> Warning: device support for raster images unknown, ignoring 'raster=TRUE'
 plot_voronoi(smpl, region ~ x * y)
#> Warning: device support for raster images unknown, ignoring 'raster=TRUE'
plot_voronoi(smpl, region ~ x * y)
#> Warning: device support for raster images unknown, ignoring 'raster=TRUE'