Predicts the abundance percentages of each endmember at all sample points using the Non-Negative Least Squares method.
# S3 method for class 'nfindr'
predict(object, newdata, ...)

# S3 method for class 'vca'
predict(object, newdata, ...)
Arguments
- object
The N-FINDR/VCA structure returned by the
nfindrorvcainterface.- newdata
If the data stored in the object is not the data that should be checked for abundances, then this parameter allows for passing in new data.
- ...
Allow for extra parameters to match the signature of the base predict function. For example, you may wish to pass different data in as argument
newdata. By default, the data inobjectwill be used.
Value
A matrix where the abundances for an endmember are returned
column-wise. Each value is in the range [0 - 1].
Examples
data(demo_data)
demo <- vca(demo_data, p = 3)
pred_wM <- predict(demo)
#> Warning: This function is deprecated. Please use 'abundances' function instead.
# The following is from demo_data
set.seed(123)
n <- 10 # no. of samples
p <- 20 # no. of frequencies
## endmembers / pure spectra / endmember matrix
em1 <- c(0, 0, 0, 5, 0, 0, 0, 0, 3, 0, 0, 0, 0, 0, 0, 0, 0, 6, 0, 0)
em2 <- c(0, 0, 0, 0, 0, 8, 7, 0, 0, 0, 0, 0, 0, 4, 0, 0, 0, 0, 0, 0)
em3 <- c(0, 0, 8, 0, 0, 0, 0, 0, 0, 0, 0, 0, 0, 0, 2, 0, 0, 0, 0, 0)
eM <- matrix(c(em1, em2, em3), byrow = TRUE, ncol = 20)
## weights matrix
wM <- matrix(runif(30), nrow = n)
# set certain samples (weights) to pure endmembers
wM[3, c(2, 3)] <- 0 # em1
wM[7, c(1, 3)] <- 0 # em2
wM[9, c(1, 2)] <- 0 # em3
wM <- wM/rowSums(wM) # normalize weights matrix
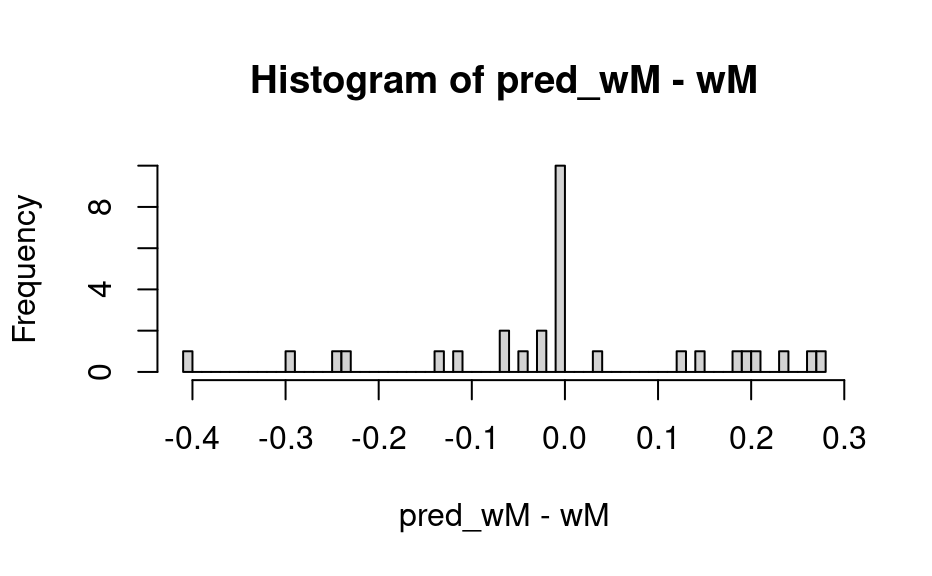
# Now compare the predicted abundances to the known values
hist(pred_wM - wM, breaks = 50)