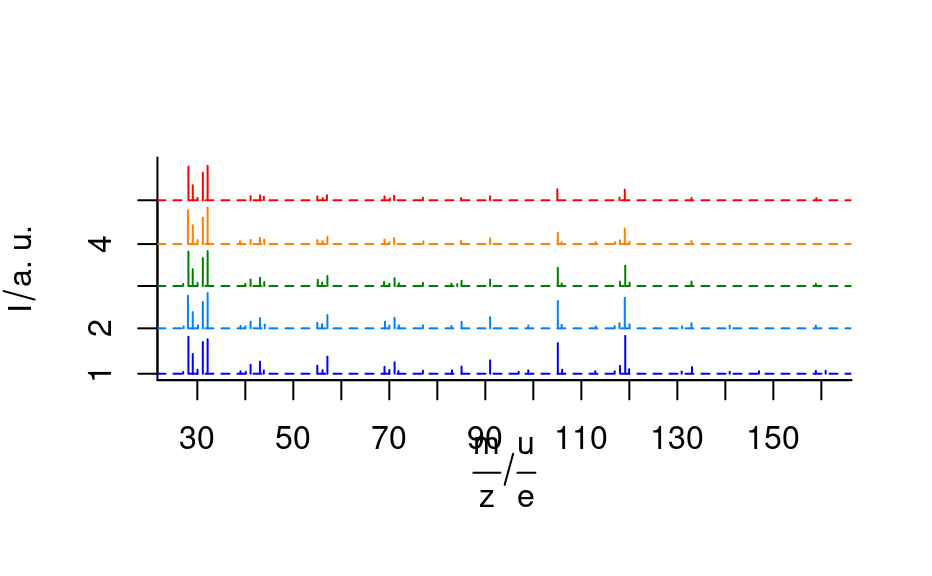
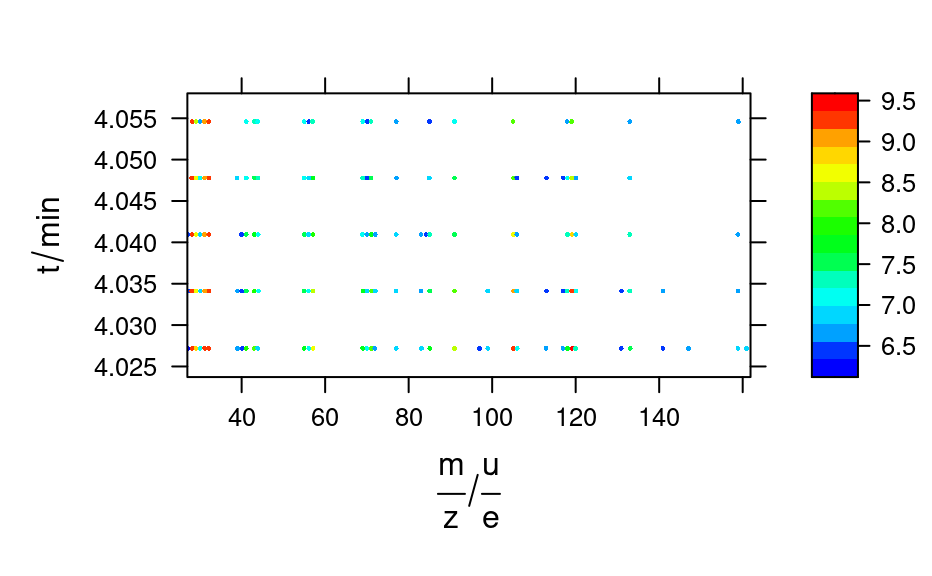
A time series of mass spectra in a list of hyperSpec objects.
barbituratesFormat
The data sets consists of a list of 5 hyperSpec objects with a single spectrum each. They are the first five spectra of the BARBITUATES.SPC example data from Thermo Galactic's spc file format specification.
References
The raw data is available with package hySpc.read.spc.
Examples
barbiturates
#> [[1]]
#> hyperSpec object
#>    1 spectra
#>    4 data columns
#>    37 data points / spectrum
#>
#> [[2]]
#> hyperSpec object
#>    1 spectra
#>    4 data columns
#>    34 data points / spectrum
#>
#> [[3]]
#> hyperSpec object
#>    1 spectra
#>    4 data columns
#>    29 data points / spectrum
#>
#> [[4]]
#> hyperSpec object
#>    1 spectra
#>    4 data columns
#>    26 data points / spectrum
#>
#> [[5]]
#> hyperSpec object
#>    1 spectra
#>    4 data columns
#>    22 data points / spectrum
#>
length(barbiturates)
#> [1] 5

barb <- collapse(barbiturates, collapse.equal = FALSE)
barb <- wl_sort(barb)

plot(barb,
  lines.args = list(type = "h"),
  col = palette_matlab_dark(5), stacked = TRUE,
  stacked.args = list(add.factor = .2)
)


if (require(latticeExtra)) {
  levelplot(spc ~ .wavelength * z, log(barb),
    panel = panel.levelplot.points,
    cex = 0.3, col = "#00000000", col.regions = palette_matlab(20)
  )
}
#> Loading required package: latticeExtra
#>
#> Attaching package: ‘latticeExtra’
#> The following object is masked from ‘package:ggplot2’:
#>
#>     layer
#> Warning: device support for raster images unknown, ignoring 'raster=TRUE'


plot_c(apply(barb[, , 42.9 ~ 43.2], 1, sum, na.rm = TRUE), spc ~ z,
  panel = panel.lines, ylab = expression(I[m / z == 43] / "a.u.")
)
