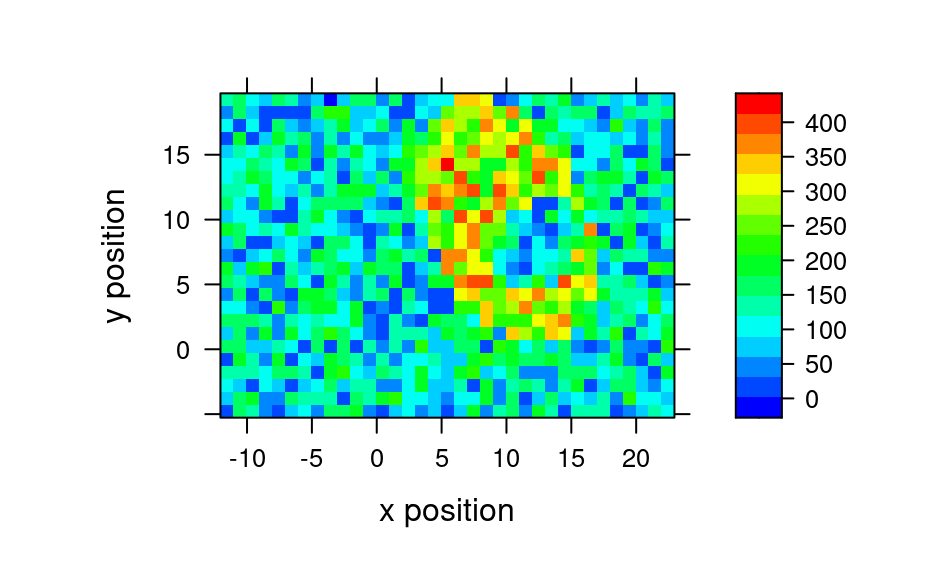
Two palettes going from blue over green to red, approximately as the standard palette of Matlab does. The second one has darker green values and is better suited for plotting lines on white background.
palette_matlab(n = 100, ...)

palette_matlab_dark(n = 100, ...)

palette_alois(n = 100, ...)
Arguments
- n
the number of colors to be in the palette.
- ...
further arguments are handed to
grDevices::rainbow()(palette_alois:grDevices::colorRampPalette()).
Value
A vector containing the color values in the form "#rrbbggaa".
See also
Examples
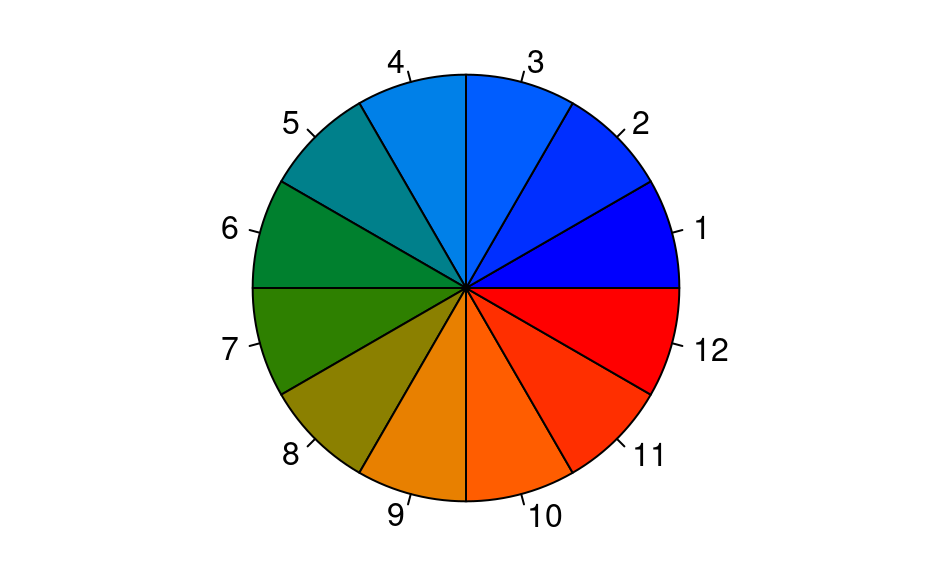
# Matlab dark palette
op <- par(mar = c(0, 0, 0, 0))
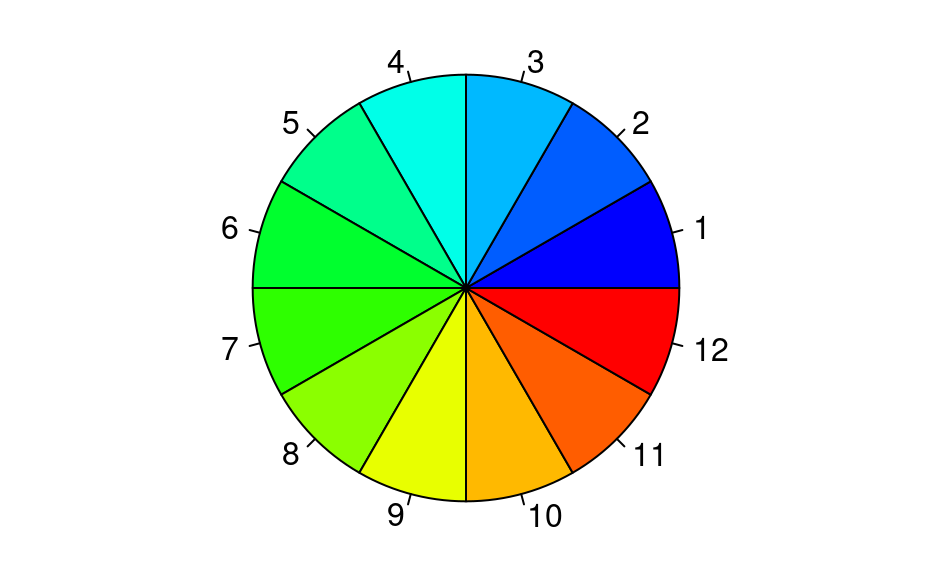
pie(rep(1, 12), col = palette_matlab(12))
 par(op)
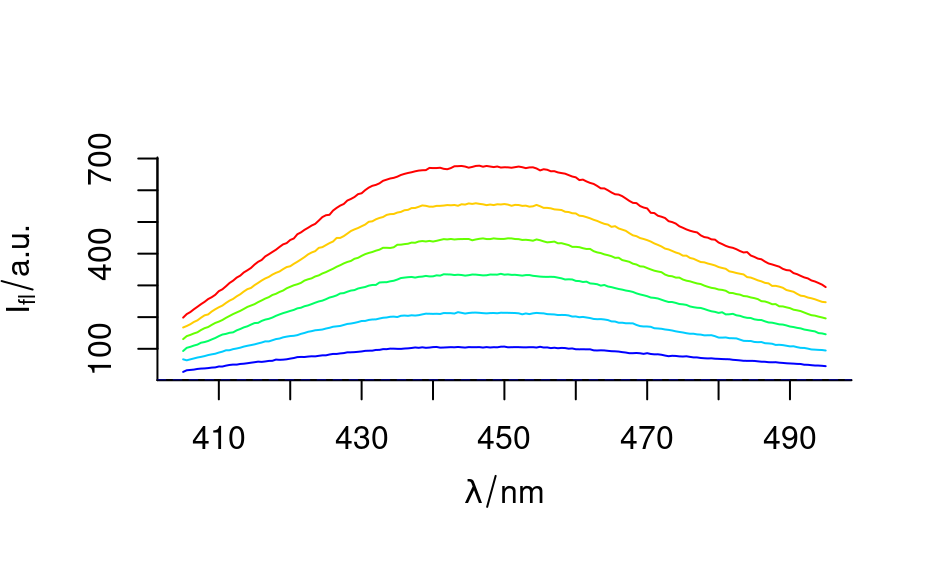
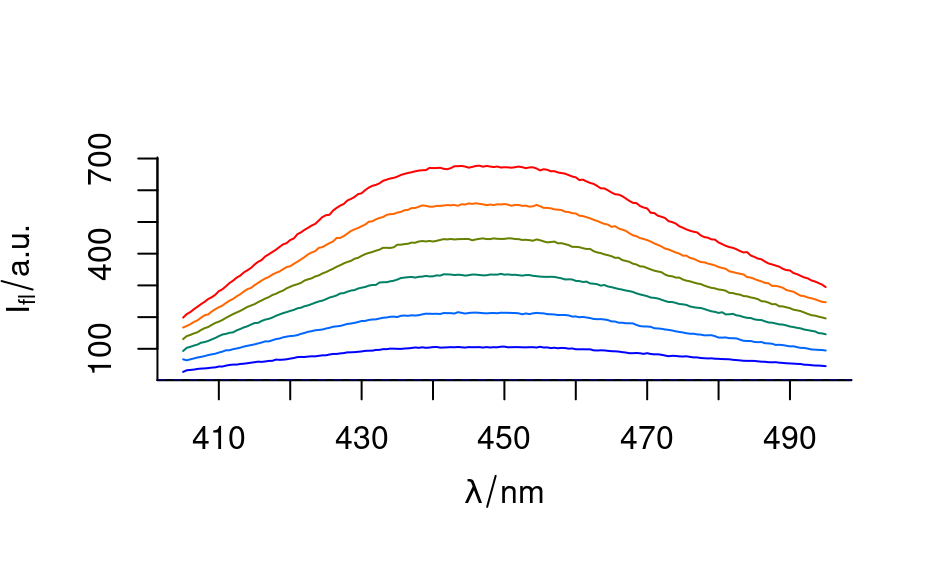
plot(flu, col = palette_matlab(nrow(flu)))
par(op)
plot(flu, col = palette_matlab(nrow(flu)))
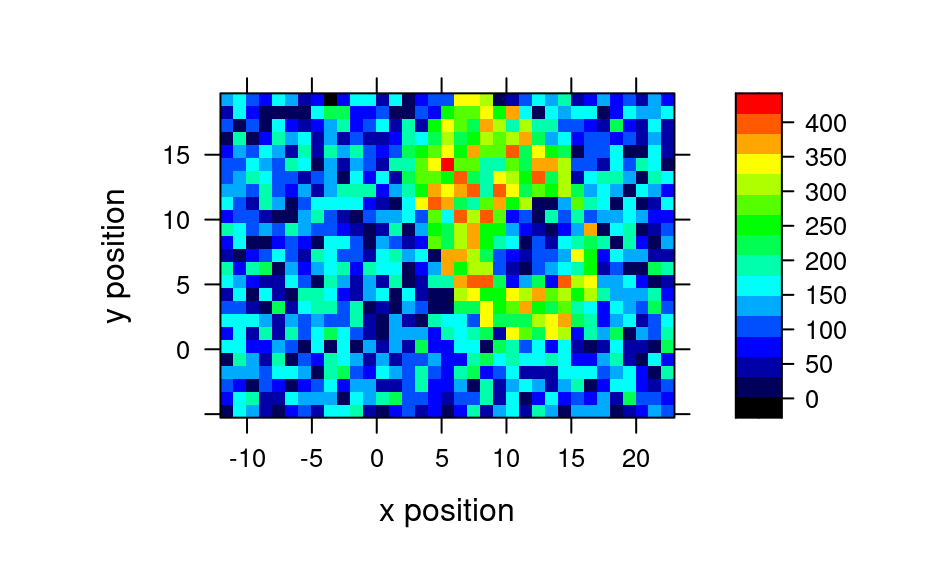
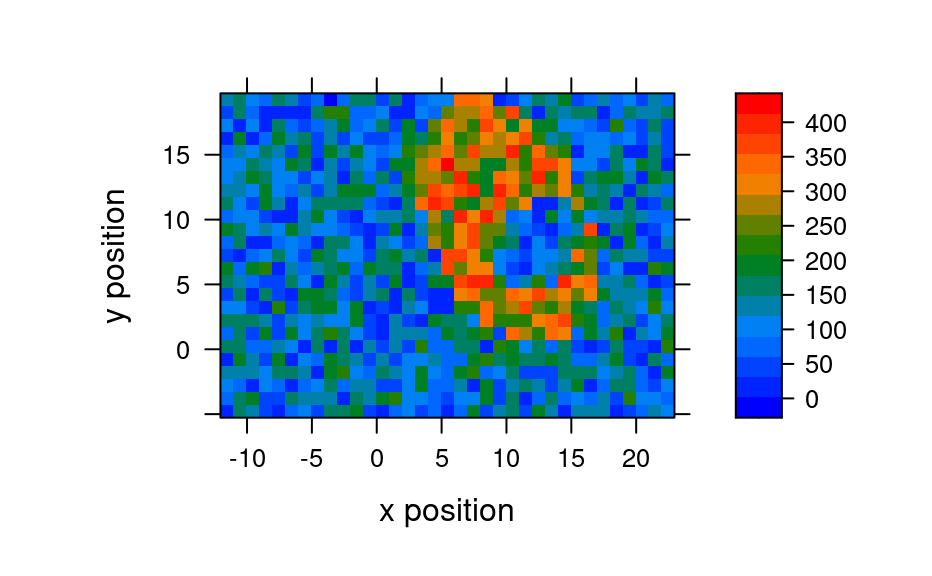
 plot_map(faux_cell[, , 1200], col.regions = palette_matlab())
#> Warning: device support for raster images unknown, ignoring 'raster=TRUE'
plot_map(faux_cell[, , 1200], col.regions = palette_matlab())
#> Warning: device support for raster images unknown, ignoring 'raster=TRUE'
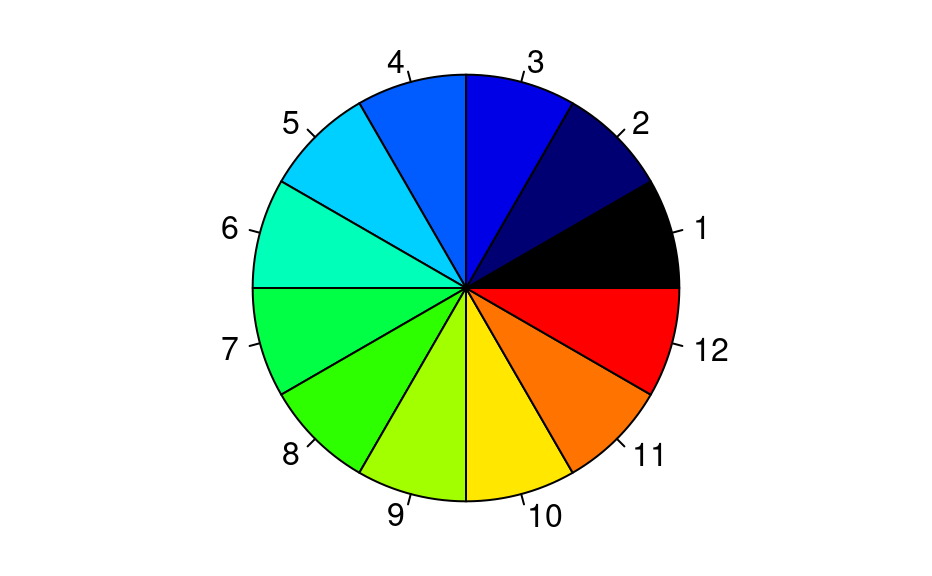
 # Matlab dark palette
op <- par(mar = c(0, 0, 0, 0))
pie(rep(1, 12), col = palette_matlab_dark(12))
# Matlab dark palette
op <- par(mar = c(0, 0, 0, 0))
pie(rep(1, 12), col = palette_matlab_dark(12))
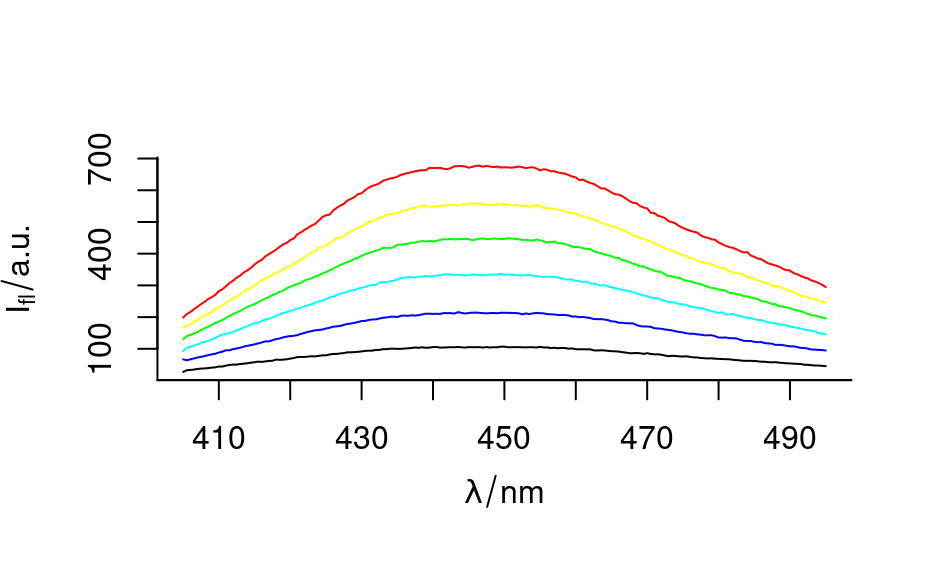
 par(op)
plot(flu, col = palette_matlab_dark(nrow(flu)))
par(op)
plot(flu, col = palette_matlab_dark(nrow(flu)))
 plot_map(faux_cell[, , 1200], col.regions = palette_matlab_dark())
#> Warning: device support for raster images unknown, ignoring 'raster=TRUE'
plot_map(faux_cell[, , 1200], col.regions = palette_matlab_dark())
#> Warning: device support for raster images unknown, ignoring 'raster=TRUE'
 # Alois palette
op <- par(mar = c(0, 0, 0, 0))
pie(rep(1, 12), col = palette_alois(12))
# Alois palette
op <- par(mar = c(0, 0, 0, 0))
pie(rep(1, 12), col = palette_alois(12))
 par(op)
plot(flu, col = palette_alois(nrow(flu)))
par(op)
plot(flu, col = palette_alois(nrow(flu)))
 plot_map(faux_cell[, , 1200], col.regions = palette_alois())
#> Warning: device support for raster images unknown, ignoring 'raster=TRUE'
plot_map(faux_cell[, , 1200], col.regions = palette_alois())
#> Warning: device support for raster images unknown, ignoring 'raster=TRUE'