Fluorescence spectra of different dilutions of quinine forming a calibration set.
Format
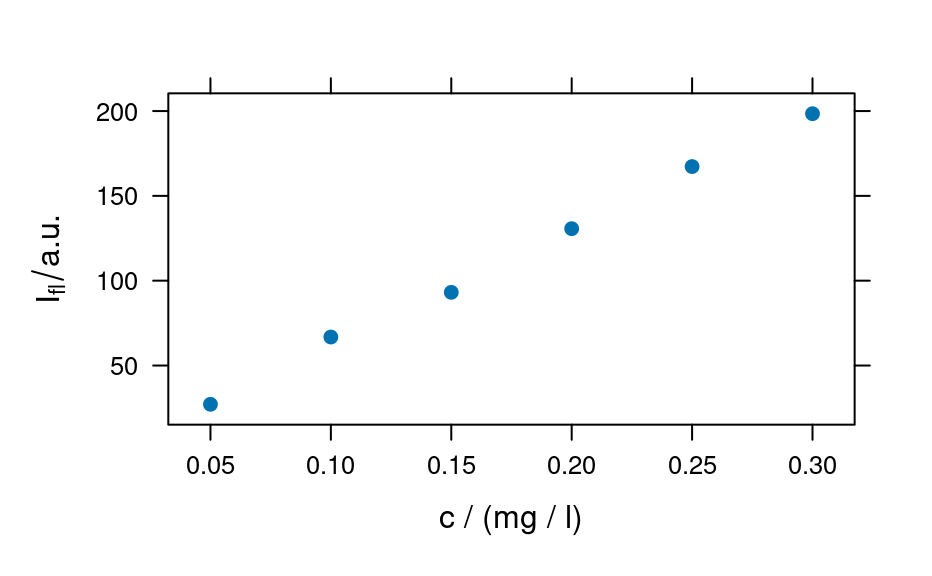
The data set has 6 fluorescence emission spectra measured on quinine concentrations between 0.05 mg/l and 0.30 mg/l. Each spectrum consists of 181 data points in the range of 405 nm to 495 nm.
Details
See the vignette: vignette("flu", package = "hyperSpec")