Compute summary statistics for subsets of a hyperSpec object.
Arguments
- x
hyperSpecobject.- by
grouping for the rows of
x@data.
Either a list containing an index vector for each of the subgroups or a vector that can besplitin such a list.- FUN
function to compute the summary statistics
- ...
further arguments passed to
FUN- out.rows
number of rows in the resulting
hyperSpecobject, for memory pre-allocation.- append.rows
If more rows are needed, how many should be appended?
Defaults to 100 or an estimate based on the percentage of groups that are still to be done, whatever is larger.- by.isindex
If a list is given in
by: does the list already contain the row indices of the groups? IfFALSE, the list inbyis computed first (as instats::aggregate()).
Value
A hyperSpec object with an additional column @data$.aggregate
tracing which group the rows belong to.
Details
aggregate() applies FUN to each of the subgroups given by by.
It combines the functionality of stats::aggregate(), base::tapply(),
and stats::ave() for hyperSpec objects.
aggregate() avoids splitting x@data.
FUN does not need to return exactly one value. The number of
returned values needs to be the same for all wavelengths (otherwise the
result could not be a matrix), see the examples.
If the initially pre-allocated data.frame turns out to be too small,
more rows are appended and a warning is issued.
See also
Examples
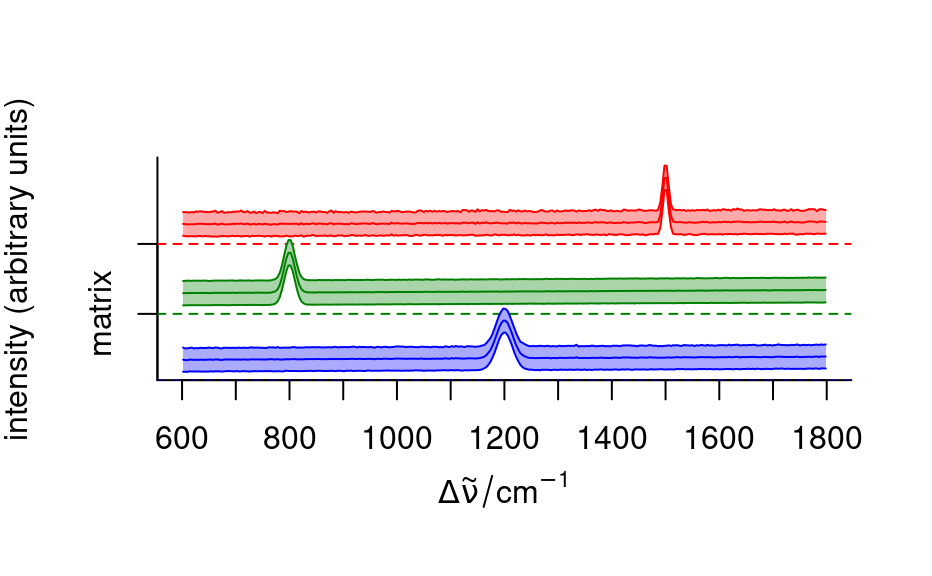
region.means <- aggregate(faux_cell, faux_cell$region, mean_pm_sd)
plot(region.means,
stacked = ".aggregate", fill = ".aggregate",
col = palette_matlab_dark(3)
)
 ## make some "spectra"
spc <- new(
"hyperSpec",
spc = sweep(matrix(rnorm(10 * 20), ncol = 20), 1, (1:10) * 5, "+")
)
## 3 groups
color <- c("red", "blue", "black")
by <- as.factor(c(1, 1, 1, 1, 1, 1, 5, 1, 2, 2))
by
#> [1] 1 1 1 1 1 1 5 1 2 2
#> Levels: 1 2 5
plot(spc, "spc", col = color[by])
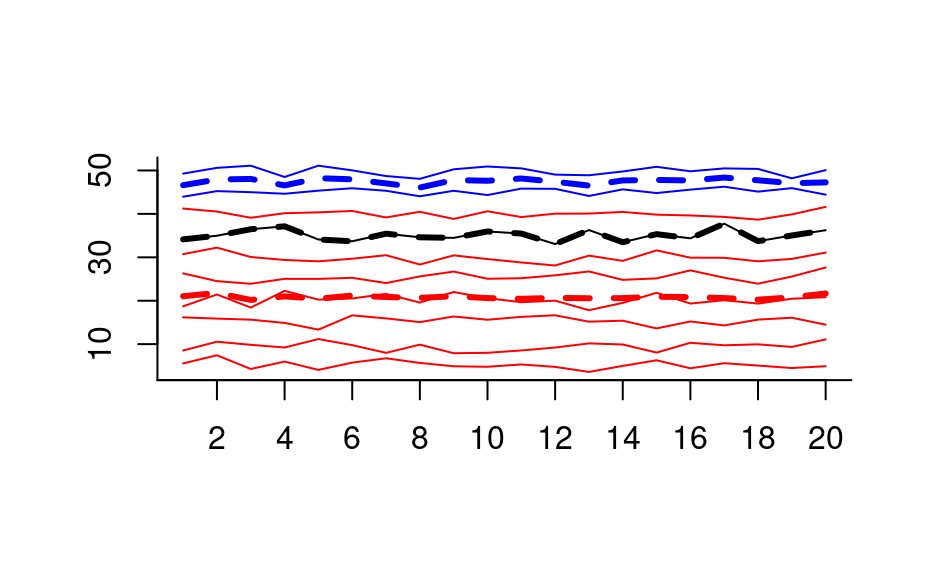
## Example 1: plot the mean of the groups
plot(aggregate(spc, by, mean), "spc",
col = color, add = TRUE,
lines.args = list(lwd = 3, lty = 2)
)
## make some "spectra"
spc <- new(
"hyperSpec",
spc = sweep(matrix(rnorm(10 * 20), ncol = 20), 1, (1:10) * 5, "+")
)
## 3 groups
color <- c("red", "blue", "black")
by <- as.factor(c(1, 1, 1, 1, 1, 1, 5, 1, 2, 2))
by
#> [1] 1 1 1 1 1 1 5 1 2 2
#> Levels: 1 2 5
plot(spc, "spc", col = color[by])
## Example 1: plot the mean of the groups
plot(aggregate(spc, by, mean), "spc",
col = color, add = TRUE,
lines.args = list(lwd = 3, lty = 2)
)
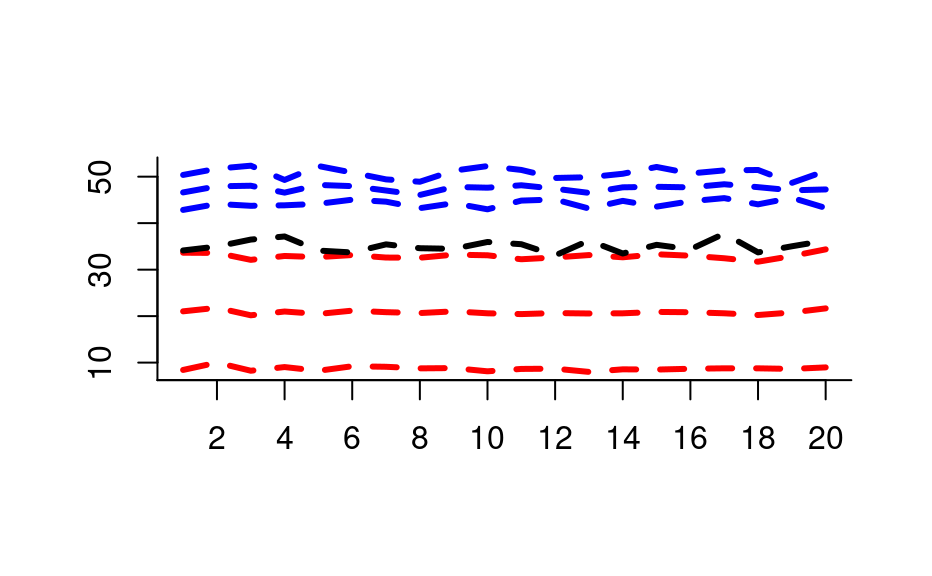
 ## Example 2: FUN may return more than one value (here: 3)
plot(aggregate(spc, by, mean_pm_sd), "spc",
col = rep(color, each = 3), lines.args = list(lwd = 3, lty = 2)
)
## Example 2: FUN may return more than one value (here: 3)
plot(aggregate(spc, by, mean_pm_sd), "spc",
col = rep(color, each = 3), lines.args = list(lwd = 3, lty = 2)
)
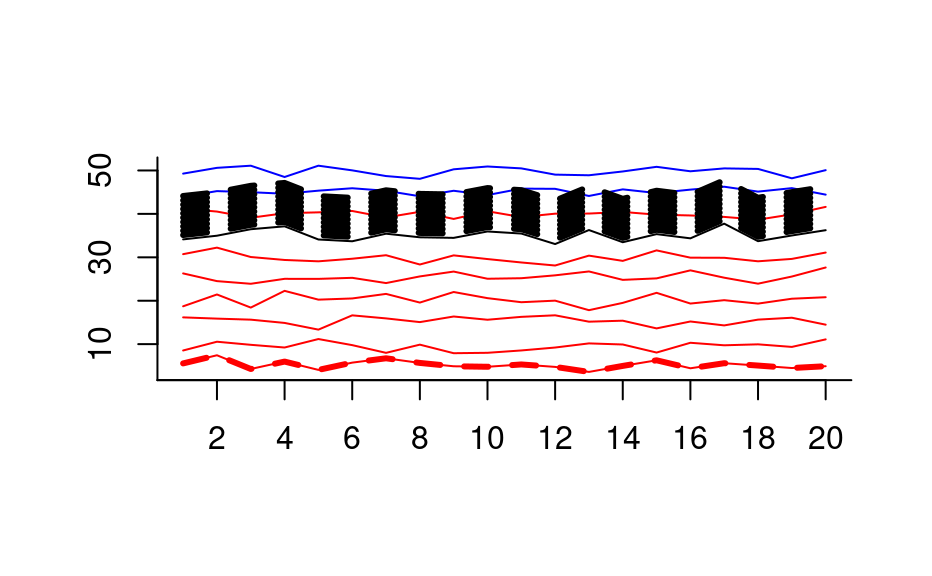
 ## Example 3: aggregate even takes FUN that return different numbers of
## values for different groups
plot(spc, "spc", col = color[by])
weird.function <- function(x) {
if (length(x) == 1) {
x + 1:10
} else if (length(x) == 2) {
NULL
} else {
x[1]
}
}
agg <- aggregate(spc, by, weird.function)
#> Warning: At3of3levels: Output data.frame too small. Consider using anappropriate value for out.rows to speed up calculations.
agg$.aggregate
#> [1] 1 5 5 5 5 5 5 5 5 5 5
#> Levels: 1 2 5
plot(agg, "spc",
add = TRUE, col = color[agg$.aggregate],
lines.args = list(lwd = 3, lty = 2)
)
## Example 3: aggregate even takes FUN that return different numbers of
## values for different groups
plot(spc, "spc", col = color[by])
weird.function <- function(x) {
if (length(x) == 1) {
x + 1:10
} else if (length(x) == 2) {
NULL
} else {
x[1]
}
}
agg <- aggregate(spc, by, weird.function)
#> Warning: At3of3levels: Output data.frame too small. Consider using anappropriate value for out.rows to speed up calculations.
agg$.aggregate
#> [1] 1 5 5 5 5 5 5 5 5 5 5
#> Levels: 1 2 5
plot(agg, "spc",
add = TRUE, col = color[agg$.aggregate],
lines.args = list(lwd = 3, lty = 2)
)