This is a synthetic data set intended for testing and demonstration.
Function generate_faux_cell() simulates the faux cell data (note: in
the future, it is planned to parameterize the funcion) and object faux_cell
is an instance of this dataset generated first time it is used.
The data set resembles the
chondro
data set but is entirely synthetic.
generate_faux_cell()

faux_cell
Format
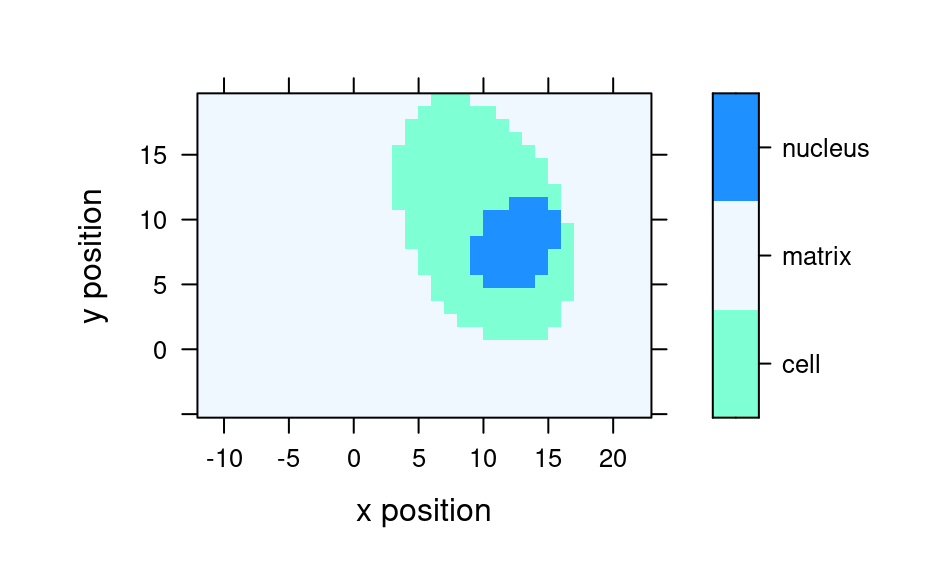
The object faux_cell is a hyperSpec object that contains 875
Raman-like spectra, allocated to three groups/regions in column region:
the matrix/background, the cell and the cell nucleus. Each spectrum is
composed of 300 data points. The spectrum of each region is unique and
simple, with a single peak at a particular frequency and line width.
Poisson noise has been added. The data is indexed along the x and y
dimensions, simulating data collected on a grid.
An object of class hyperSpec of dimension 875 x 4 x 300.
Examples
set.seed(1)
faux_cell <- generate_faux_cell()
faux_cell
#> hyperSpec object
#> 875 spectra
#> 4 data columns
#> 300 data points / spectrum
plot(sample(faux_cell, 10), stacked = TRUE)
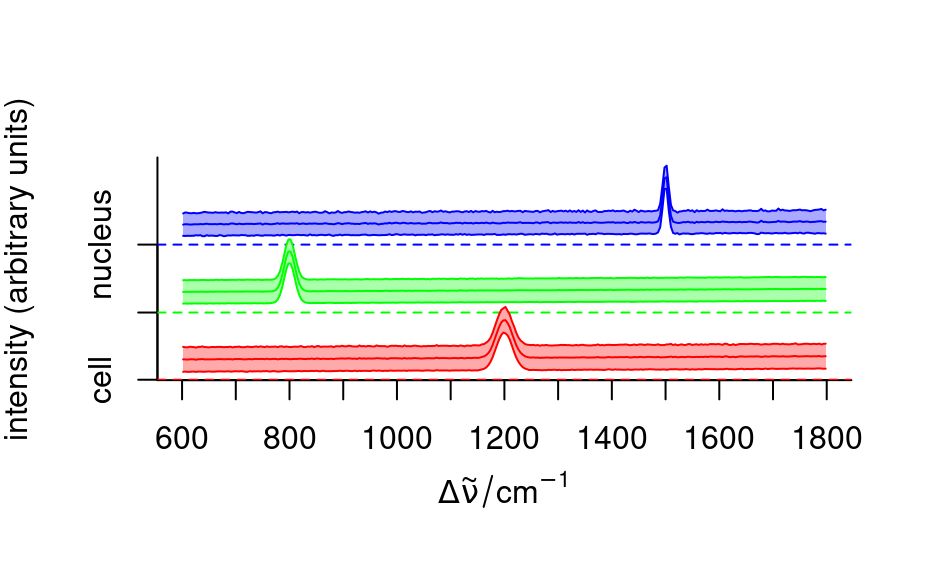
 # Plot mean spectra
fc_groups <- aggregate(faux_cell, faux_cell$region, mean_pm_sd)
plot_spc(fc_groups,
stacked = ".aggregate",
col = c("red", "green", "blue"), fill = ".aggregate"
)
# Plot mean spectra
fc_groups <- aggregate(faux_cell, faux_cell$region, mean_pm_sd)
plot_spc(fc_groups,
stacked = ".aggregate",
col = c("red", "green", "blue"), fill = ".aggregate"
)
 mapcols <- c(cell = "aquamarine", matrix = "aliceblue", nucleus = "dodgerblue")
plot_map(faux_cell, region ~ x * y, col.regions = mapcols)
#> Warning: device support for raster images unknown, ignoring 'raster=TRUE'
mapcols <- c(cell = "aquamarine", matrix = "aliceblue", nucleus = "dodgerblue")
plot_map(faux_cell, region ~ x * y, col.regions = mapcols)
#> Warning: device support for raster images unknown, ignoring 'raster=TRUE'
 # PCA
pca <- prcomp(faux_cell)
plot(pca)
# PCA
pca <- prcomp(faux_cell)
plot(pca)
 loadings <- decomposition(faux_cell, t(pca$rotation), scores = FALSE)
plot(loadings[1:5], stacked = TRUE)
loadings <- decomposition(faux_cell, t(pca$rotation), scores = FALSE)
plot(loadings[1:5], stacked = TRUE)
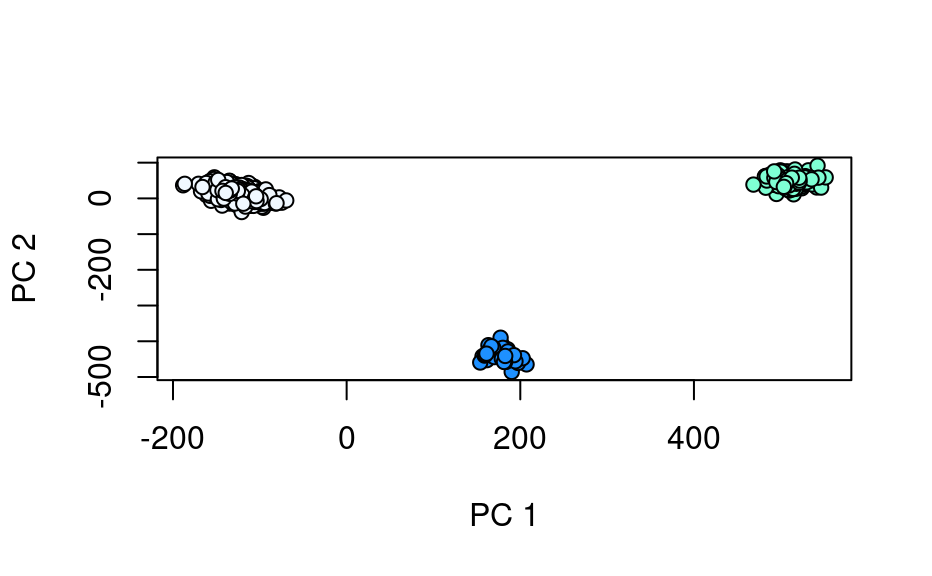
 plot(pca$x[, 2], pca$x[, 3],
xlab = "PC 1", ylab = "PC 2",
bg = mapcols[faux_cell$region], col = "black", pch = 21
)
plot(pca$x[, 2], pca$x[, 3],
xlab = "PC 1", ylab = "PC 2",
bg = mapcols[faux_cell$region], col = "black", pch = 21
)