These functions generate hyper-spectral datasets that are mainly used for exploring and testing functionality of hyperSpec.
generate_hy_spectra()generates several spectra.generate_hy_profile()generates depth, concentration, time-series profiles at a single wavelength.generate_hy_map()generates hyper-spectral map.
generate_hy_spectra(n_wl = 50, n = 20)

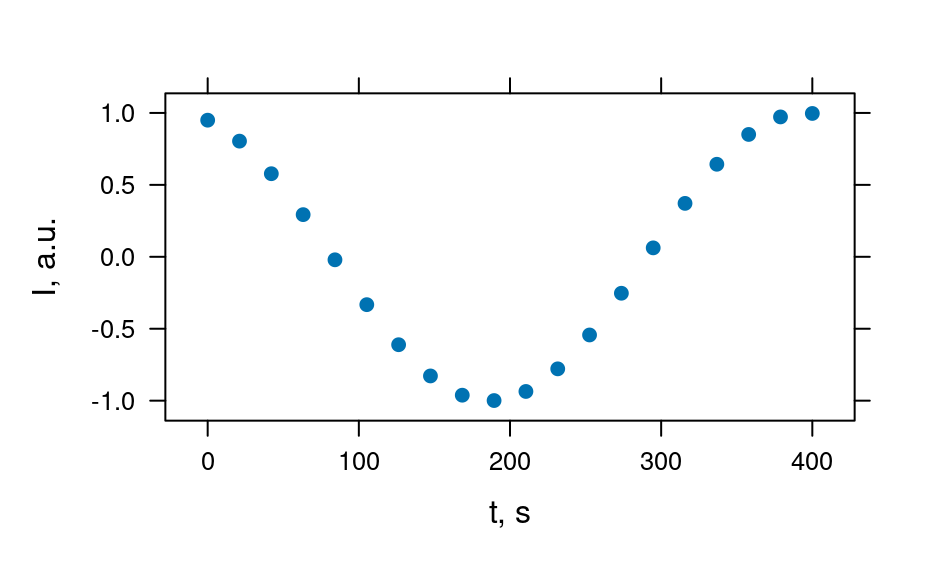
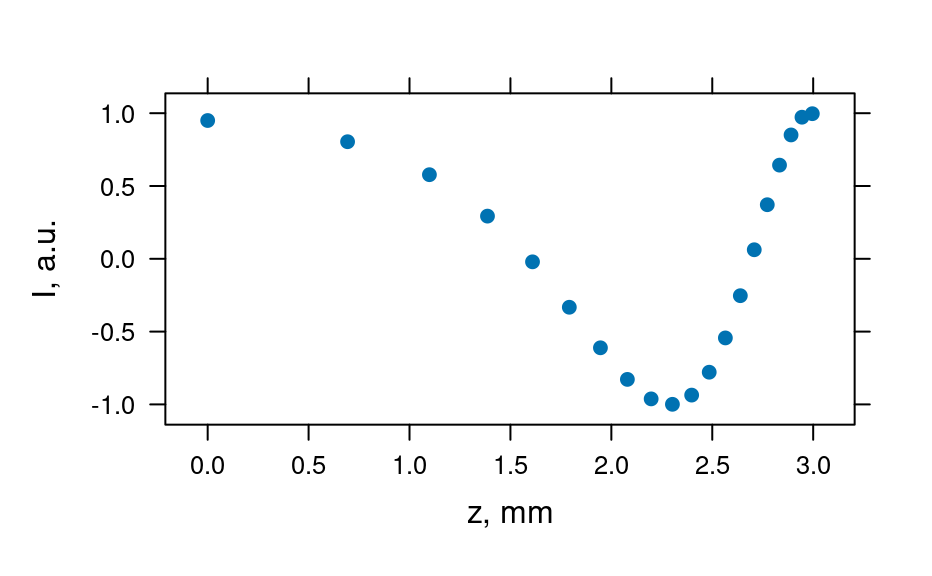
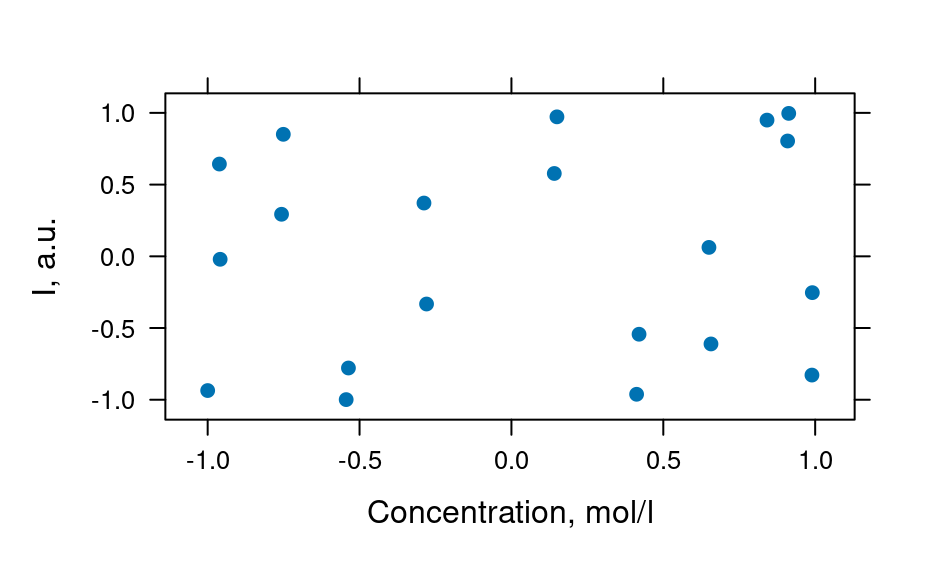
generate_hy_profile(n = 20, wavelength = 550)

generate_hy_map(n_wl = 5, n_xy = 7, k = 5)
Arguments
- n_wl
(integer) Number of wavelengths (points per spectrum).
- n
(integer) Number of spectra.
- wavelength
(numeric) A single numeric value for
wavelength.- n_xy
(integer)number of pixels in x and y directions of hyper-spectral map.
- k
integer not larger than
n_xy. Ifk = n_xy, there are no empty pixels in the map. Otherwise, some pixels are empty.
Value
A hyperSpec object.
See also
Examples
# Generate spectra
hy_spectra <- generate_hy_spectra()
hy_spectra
#> hyperSpec object
#>    20 spectra
#>    5 data columns
#>    50 data points / spectrum

plot(hy_spectra)


# Generate profiles
hy_profile <- generate_hy_profile()
hy_profile
#> hyperSpec object
#>    20 spectra
#>    4 data columns
#>    1 data points / spectrum

plot_c(hy_profile, model = spc ~ t)

plot_c(hy_profile, model = spc ~ z)

plot_c(hy_profile, model = spc ~ c)


# Generate hyper-spectral map
hy_map <- generate_hy_map()
hy_map
#> hyperSpec object
#>    35 spectra
#>    4 data columns
#>    5 data points / spectrum

plot_map(hy_map)
#> Warning: device support for raster images unknown, ignoring 'raster=TRUE'

plot_map(hy_map[, , 8000])
#> Warning: device support for raster images unknown, ignoring 'raster=TRUE'
